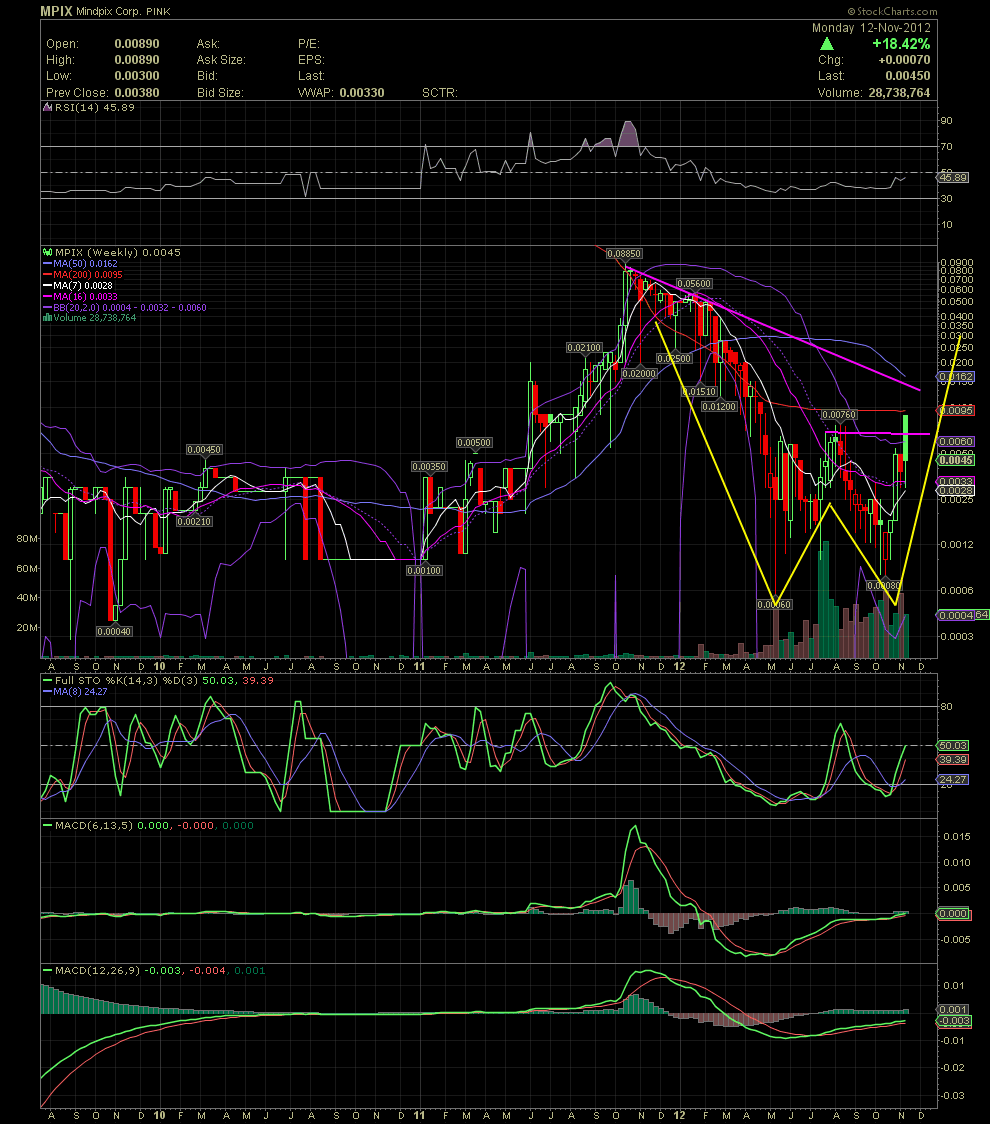
MPIX WEEKLY CHART............ WOW!! Some of yo
Post# of 5570

MPIX WEEKLY CHART............ WOW!!
Some of you might not know the significance of a 'W Formation' or a double bottom, but take a look at this weekly chart. Typically a move above the high point of the center portion of the 'W' is a good thing. We saw the beginning of that move this morning. A move and close over the .0076 would be a strong indicator that we'll be moving much higher. The MA200 is sitting at .0095. We also can see the long term declining tops line coming in at approx .014 today. The longer term RSI has a big move ahead before even getting close to the power zone of 70+. And someone has been accumulating a ton of shares over the last 4-5 months. I'm liking what I see. You've heard me mention it before, but should MPIX be able to negotiate and secure funding with their newly engaged Investment Banking firm, I believe a move above last year's high of .0885 will be seen. Only time will tell.

 (0)
(0) (0)
(0)