Investors Hangout Stock Message Boards Logo
  • Mailbox
  • Favorites
  • Boards
    • The Hangout
    • NASDAQ
    • NYSE
    • OTC Markets
    • All Boards
  • Whats Hot!
    • Recent Activity
    • Most Viewed Boards
    • Most Viewed Posts
    • Most Posted
    • Most Followed
    • Top Boards
    • Newest Boards
    • Newest Members
  • Blog
    • Recent Blog Posts
    • Recently Updated
    • News
    • Stocks
    • Crypto
    • Investing
    • Business
    • Markets
    • Economy
    • Real Estate
    • Personal Finance
  • Market Movers
  • Interactive Charts
  • Login - Join Now FREE!
  1. Home ›
  2. Stock Message Boards ›
  3. Stock Boards ›
  4. Mindpix Corporation (MPIX) Message Board

MPIX Daily Chart............ Hope everyone is hav

Message Board Public Reply | Private Reply | Keep | Replies (1)                   Post New Msg
Edit Msg () | Previous | Next


Post# of 5570
Posted On: 11/10/2012 3:37:11 PM
Avatar
Posted By: Big Tuna

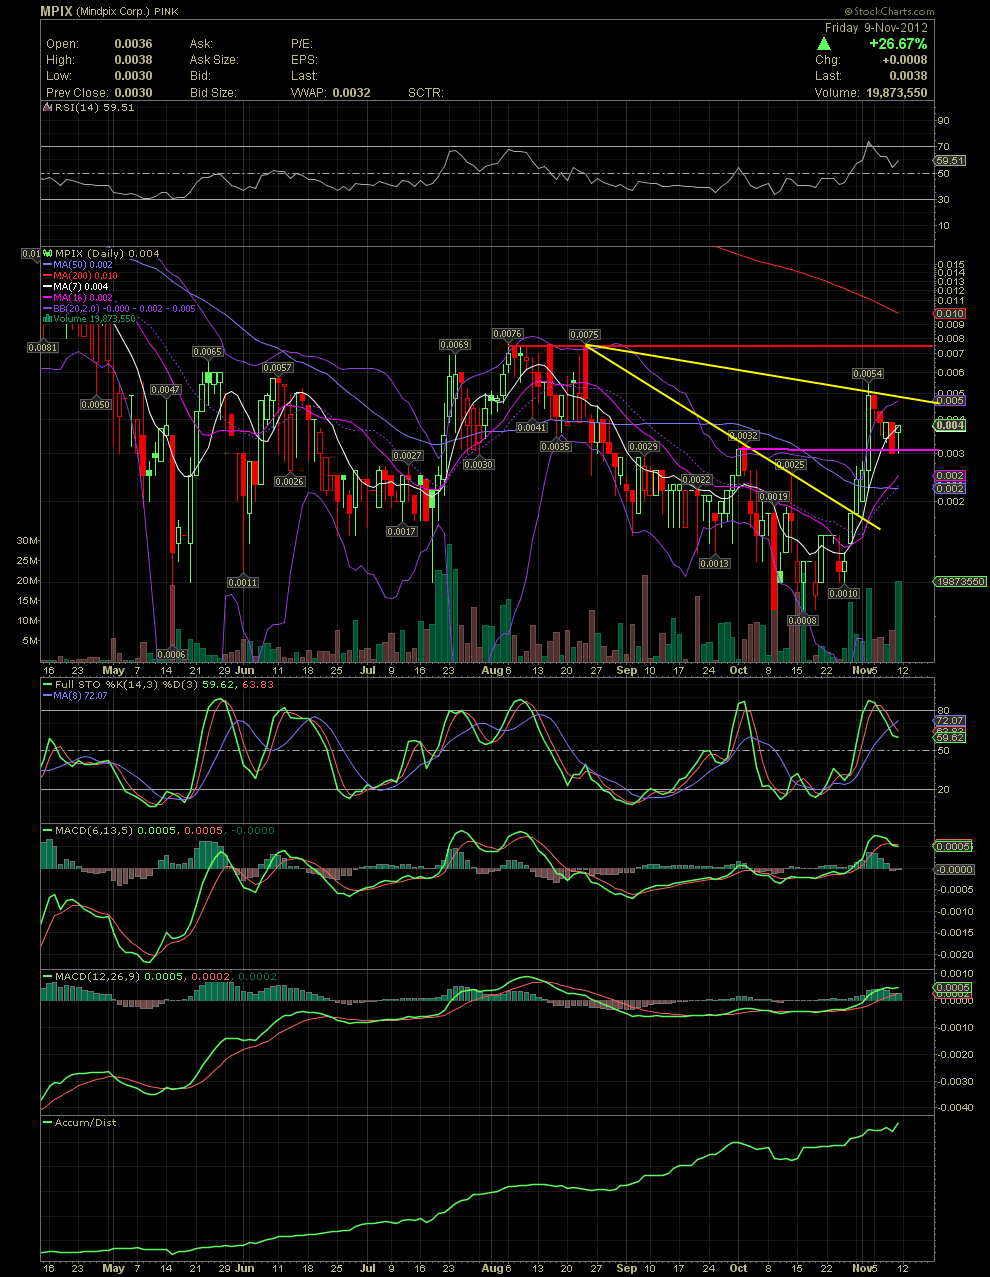
MPIX Daily Chart............ Hope everyone is having a good weekend.


As most of the technicals traders already know, a share price on any chart will trade within the bollie bands approx 85% of the time. Friday, of one week ago, saw a sharp move from under .003 to as high as .0054. If one reviews that chart, you can see that the candle was way outside the upper bollie. What goes outside the bollie, always comes back in. So the obvious move to have been expected earlier this week was to see a pullback into the bollies again. So the question that should arise is where will the stock find a bottom prior to the next leg up? One should look for previous resistance points or top that might offer support as a share price retraces. In the case of this last week, an obvious area should have been the .0031/.0032 top of late Sept/early Oct which I've drawn with a horizontal pink line. Although not a guarantee or an exact science, the stock price held at .003 before settling at a close for the week of .0038. Since the share price ran up a week ago Friday, leaving the MAs behind, most traders know that the MAs need to 'catch up' with the share price either thru a consolidation or pullback. Strong accumulation, though, continues as can be seen on the A/D line. The RSI and FullSto have come down from overbought territory while the shorter term MACD level out the last two days, and the longer term MACD continued a little higher. The green volume seen yesterday was the highest volume day since the July 20/23 period with the exception of one day.


For the coming week, it wouldn't surprise me to see a continuation of Friday's move. The upper bollie is still rising. A move above .0054 would be a strong indication that the .0076 tops of August will be tested. Should those highs be taken out, my next target would be the MA200 which is sitting at .01. Looking at Friday's candle, that's a nice green hammer there people. And with the constant selling pressure being absorbed by the longs, imo Friday was a great day with the volume of almost 20 million shares or almost $70,000.


GO MPIX - GLTA


(0)
(0)


Mindpix Corporation (MPIX) Stock Research Links


  1.  
  2.  


  3.  
  4.  
  5.  


Investors Hangout

Home

Mailbox

Message Boards

Favorites

Whats Hot

Blog

Settings

Privacy Policy

Terms and Conditions

Disclaimer

Contact Us

Whats Hot

Recent Activity

Most Viewed Boards

Most Viewed Posts

Most Posted Boards

Most Followed

Top Boards

Newest Boards

Newest Members

Investors Hangout Message Boards

Welcome To Investors Hangout

Stock Message Boards

American Stock Exchange (AMEX)

NASDAQ Stock Exchange (NASDAQ)

New York Stock Exchange (NYSE)

Penny Stocks - (OTC)

User Boards

The Hangout

Private

Global Markets

Australian Securities Exchange (ASX)

Euronext Amsterdam (AMS)

Euronext Brussels (BRU)

Euronext Lisbon (LIS)

Euronext Paris (PAR)

Foreign Exchange (FOREX)

Hong Kong Stock Exchange (HKEX)

London Stock Exchange (LSE)

Milan Stock Exchange (MLSE)

New Zealand Exchange (NZX)

Singapore Stock Exchange (SGX)

Toronto Stock Exchange (TSX)

Contact Investors Hangout

Email Us

Follow Investors Hangout

Twitter

YouTube

Facebook

Market Data powered by QuoteMedia. Copyright © 2025. Data delayed 15 minutes unless otherwise indicated (view delay times for all exchanges).
Analyst Ratings & Earnings by Zacks. RT=Real-Time, EOD=End of Day, PD=Previous Day. Terms of Use.

© 2025 Copyright Investors Hangout, LLC All Rights Reserved.

Privacy Policy |Do Not Sell My Information | Terms & Conditions | Disclaimer | Help | Contact Us