FSNN Daily Chart...................... The pul
Post# of 3881

FSNN Daily Chart......................
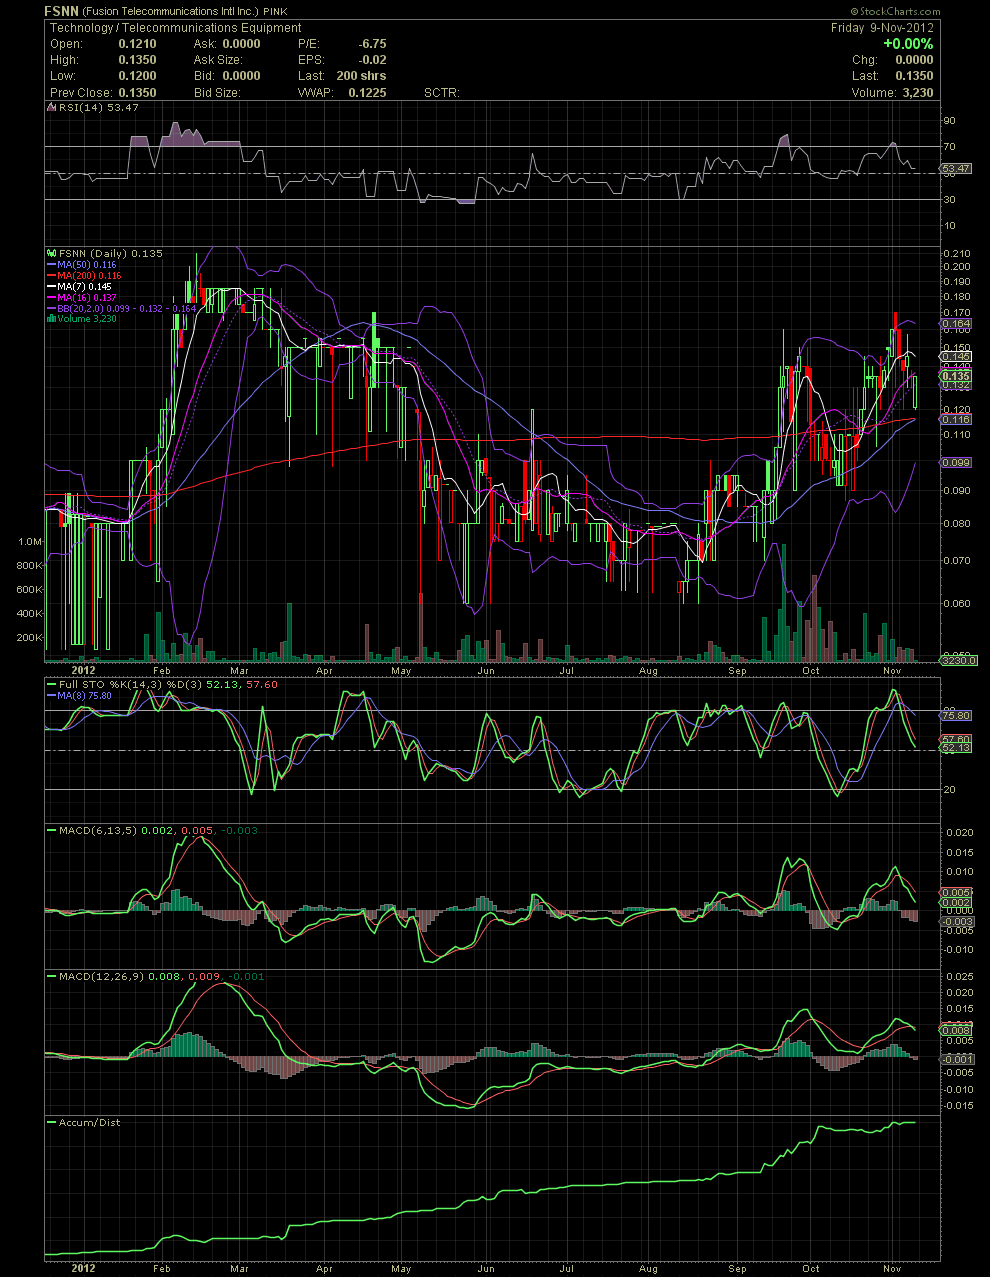
The pullback from the recent high of .17 may have found a bottom at .12 this week which was the low. Most of the indicators are still weak although the declining volume is a good sign imo. If you look at the previous points where volume declined to very low levels, notice the sharp moves to the upside. Still, the FullSto and MACDs are in a sell signal, so without news the stock will probably continue to consolidate but more so trending sideways rather than decline. As I noted in the past, a Golden Cross would occur in November. That will occur Monday or Tuesday. That might set off a few alerts as some individuals follow that indicator. I think it's more the case with the longer term investors in big board stocks rather than in penny stocks. The MA50 and 200 are longer term indicators, and in penny stocks, long term to some people is one or two days. If one was waiting to buy based solely on this Golden Cross, they would already have missed out on 85-140%. With any low priced, volatile stocks, one would be better off using the shorter term moving averages to time their trades.
From here, I would hope to see the .12 low for the last week to hold. The stock needs to move up and recapture the MA7, 16 and 20s. There is support at .116 by both the MA50 and 200. The 50 line of the FulSto would be a good one to keep your eyes on also. The last time last time the FS saw a test and hold of the 50, the stock ran from .07 to .16 within one week. News is always welcome, and should it be strong, material news, that would trump the technicals and they would play catch up. GLTA

 (0)
(0) (0)
(0)