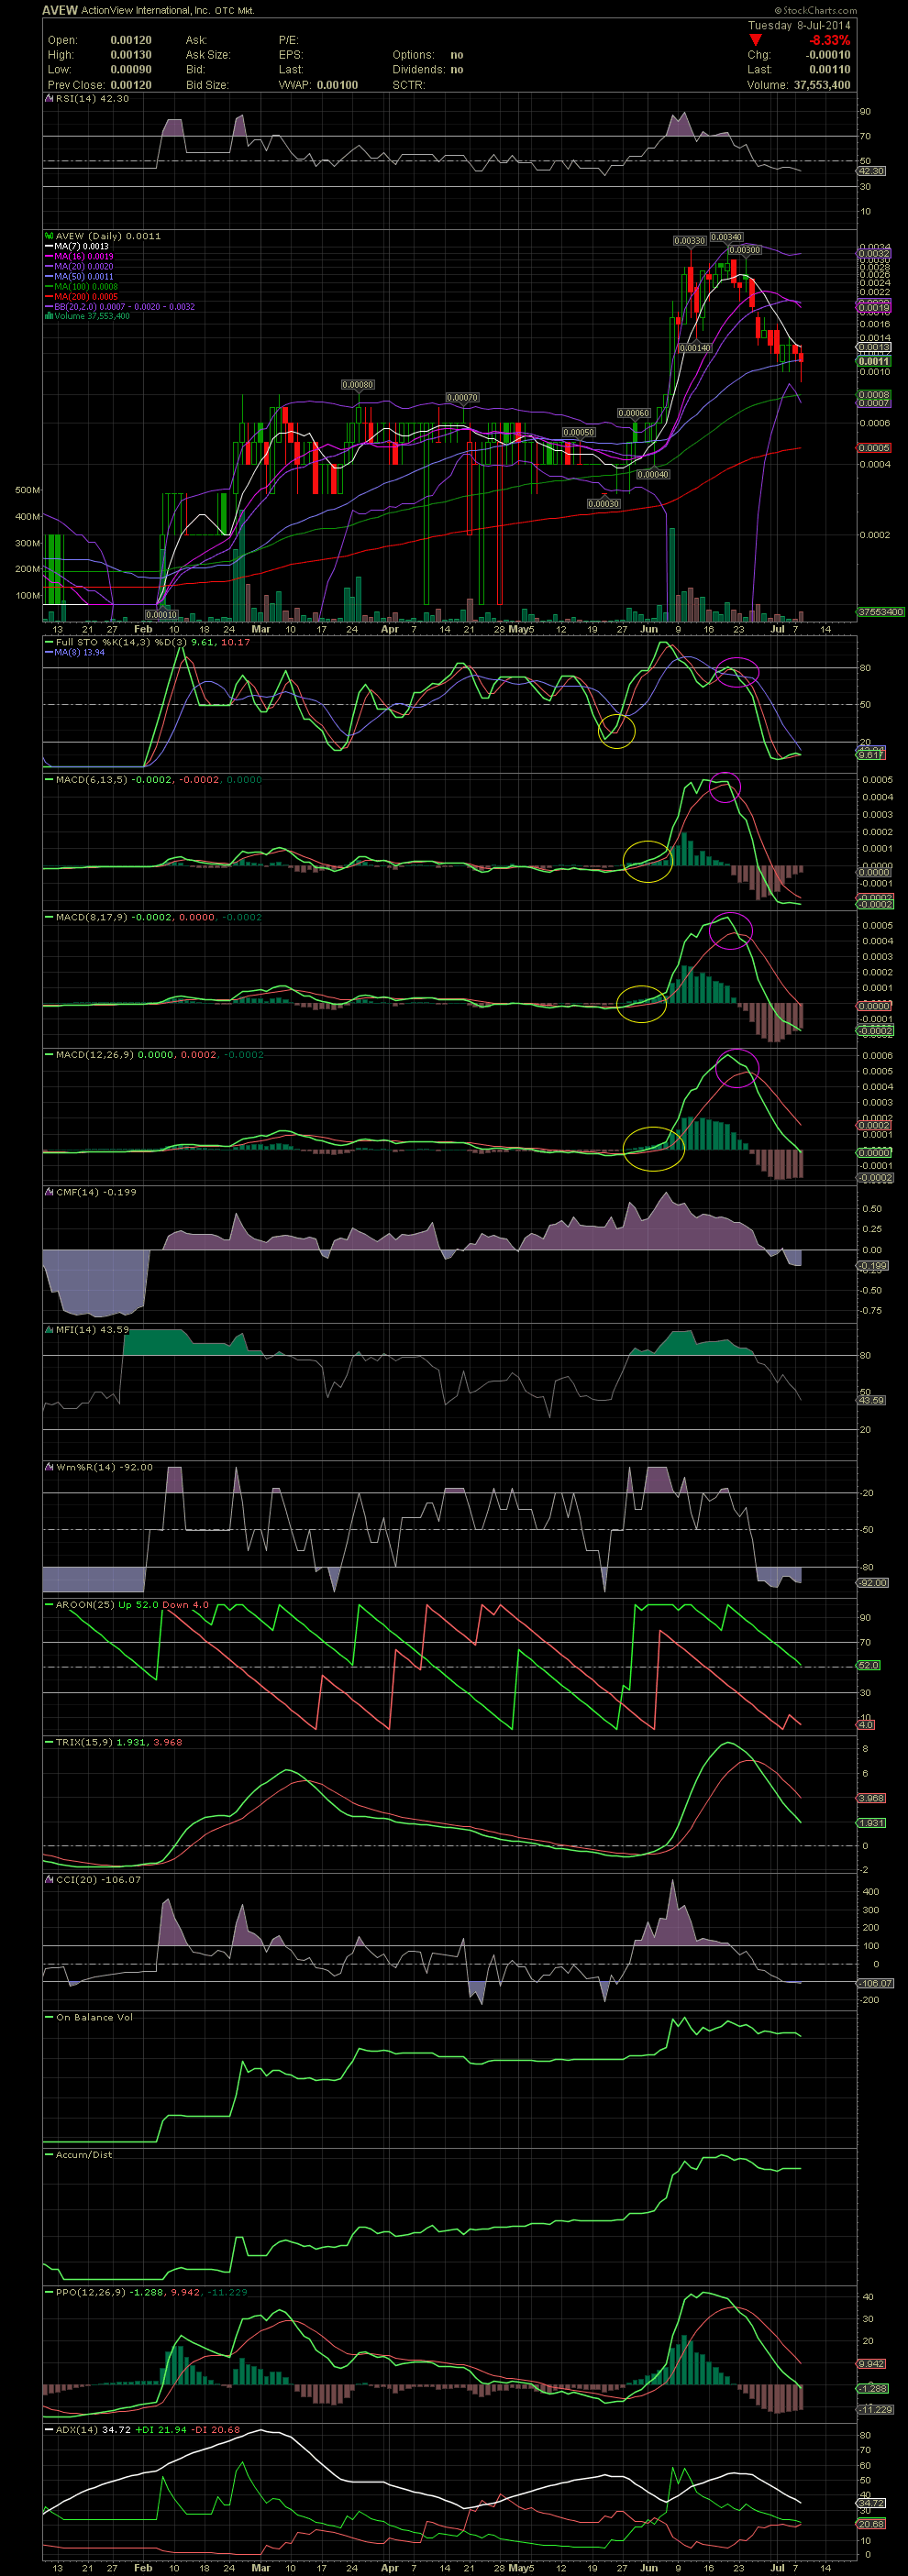
AVEW Daily Chart ~ Getting Closer to a Re-entry
Post# of 2561

After initial entries into AVEW in late May and early June, the stock rallied the .0003-.0006s to run outside the upper bollie as high as .0033. A few who sold some or all thought they missed the next leg because of scaling out of the stock during the second week of June when a large red candle traded outside that upper band. The next leg only took the stock to a high of .0034, so not much more than was seen when the chart gave its first caution signs. On that second visit to the .0033/.0034 level, please note the positioning of the FullSto and MACDs. That was one's second chance to step to the sidelines in case they missed the first opp. Since then, AVEW has fallen from .0034 to today's intraday low of .0009, while trading below the MA50 for the first time since early June. The divergence of the FS/MACD indicators has been well defined. The stock is quickly becoming oversold with the FS already in oversold territory. The 6d MACD is beginning to level out. The 8d and 12d MACDs are entering oversold levels but still have some work to do. I would keep AVEW on watch especially with the developing fundamentals. But as those of us who follow charts already know, no matter how great the story, the chart shows the momentum and money flow in most cases. Congrats to those that executed a nice trade. No we wait for the next entry. GLTA

 (0)
(0) (0)
(0)