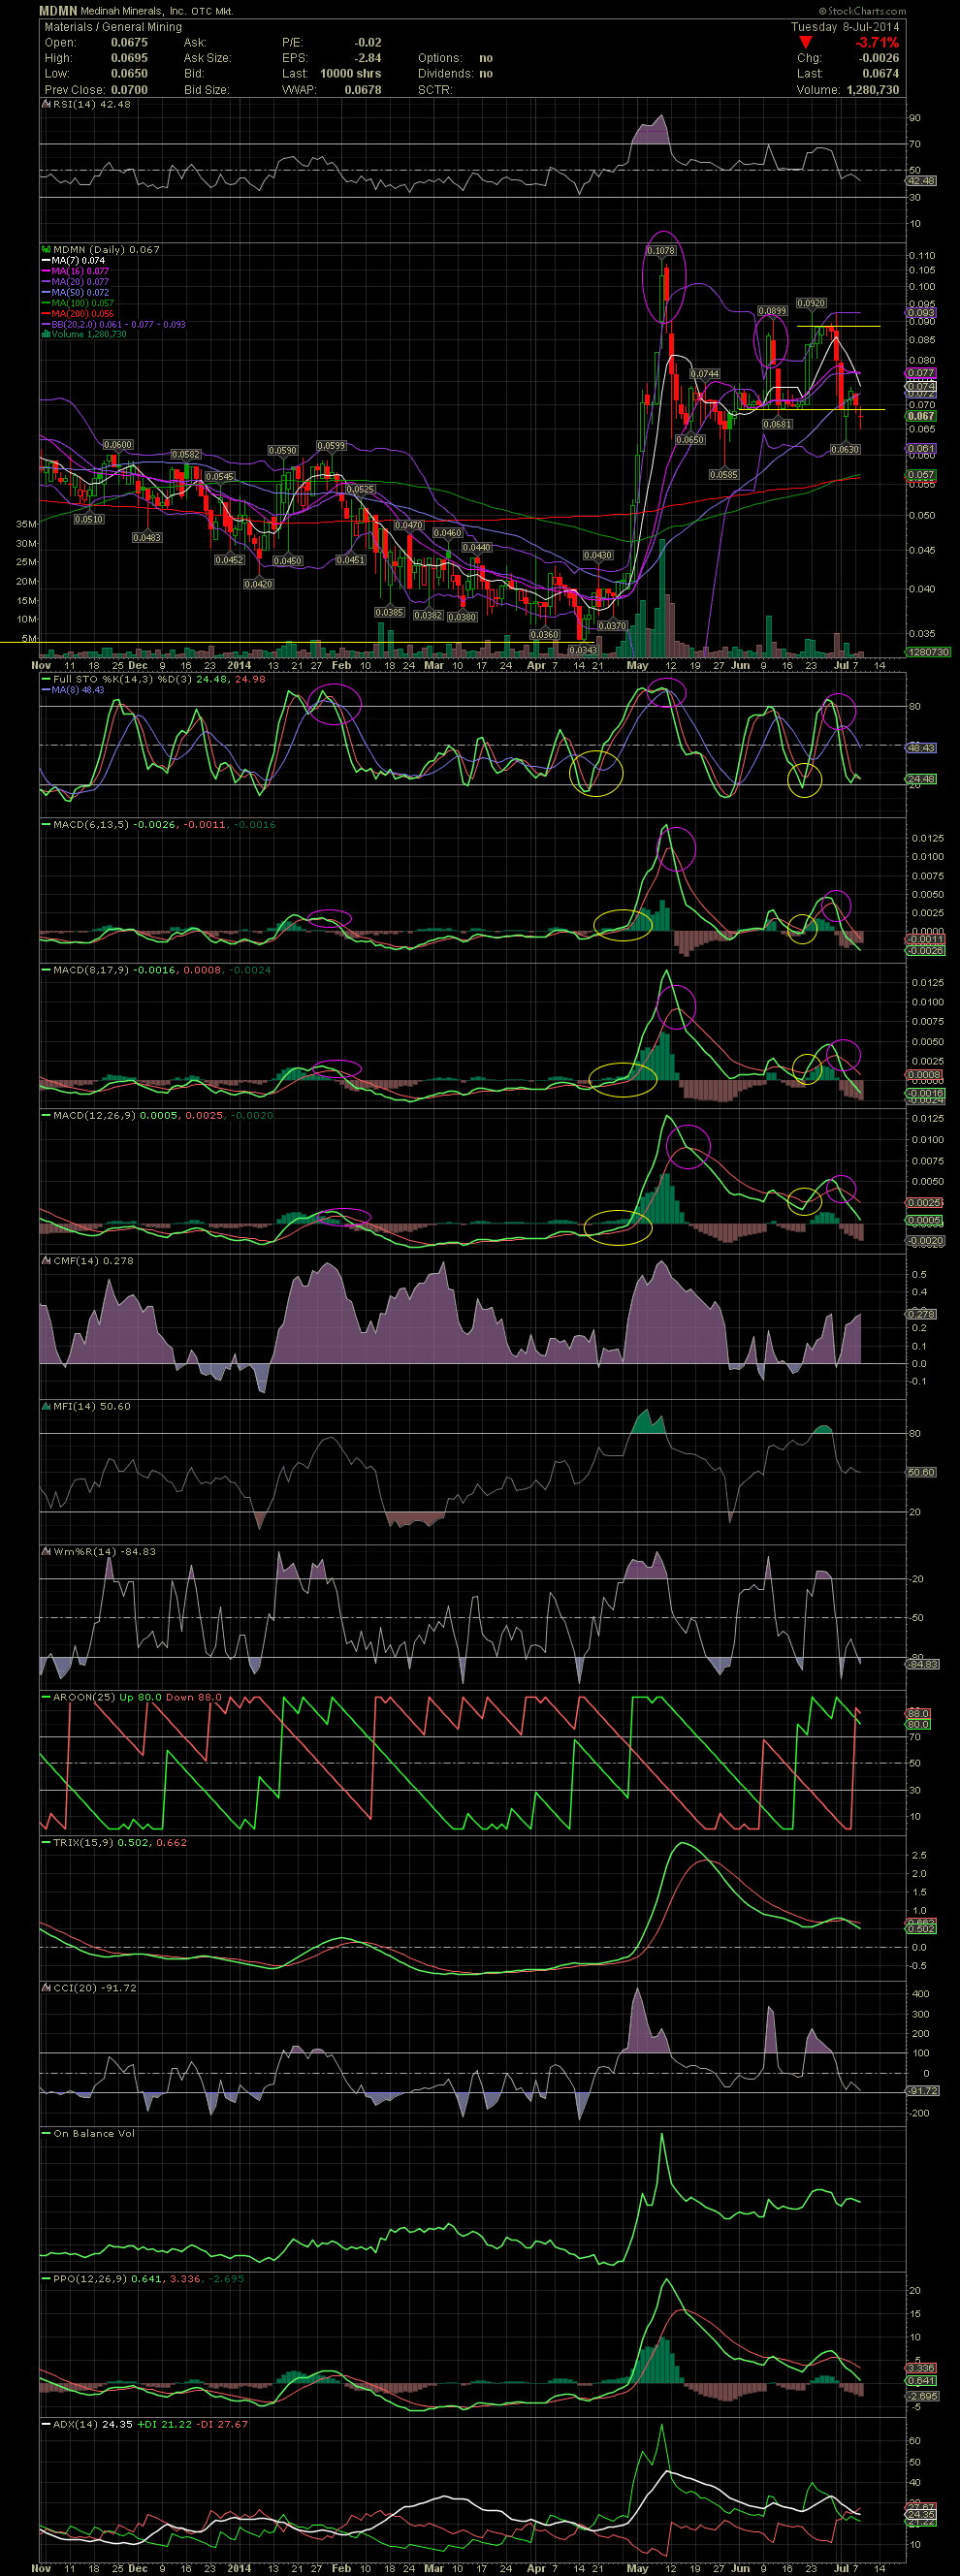
MDMN Daily Chart ~ A Sharp Decline on a Failed Bre
Post# of 2561
Link back to my June 29 MDMN chart post when the stock was still near .09. As mentioned back then, "if the stock doesn't break over the .09s quickly, one could expect a retrace towards the support level of .07." The problem now, that I see on the chart, is that MDMN has fallen under the previous support level near .068/.069. Although one day doesn't confirm a trend, should the stock linger under what is now a minor resistance level, the stock could gradually decline to the previous low in the high .05s along with a test of the MA100 and 200 at .057/.056. The MACDs are showing downside divergence, so watching might be the best thing at the moment for those that executed a swing trade or two in June. I know quite a few who did just that and are now looking for the chart to reset for another swing. Oh how I wished I had been doing the same over the last many years in Medinahland. But it's never too late to do just that, so drive on traders! MDMN is one of the best penny stocks to swing. GLTA

 (0)
(0) (0)
(0)