PNTV Weekly Chart ~ Five Consecutive Weeks of Gree
Post# of 382
Posted On: 06/29/2014 3:32:13 PM

PNTV Weekly Chart ~ Five Consecutive Weeks of Green
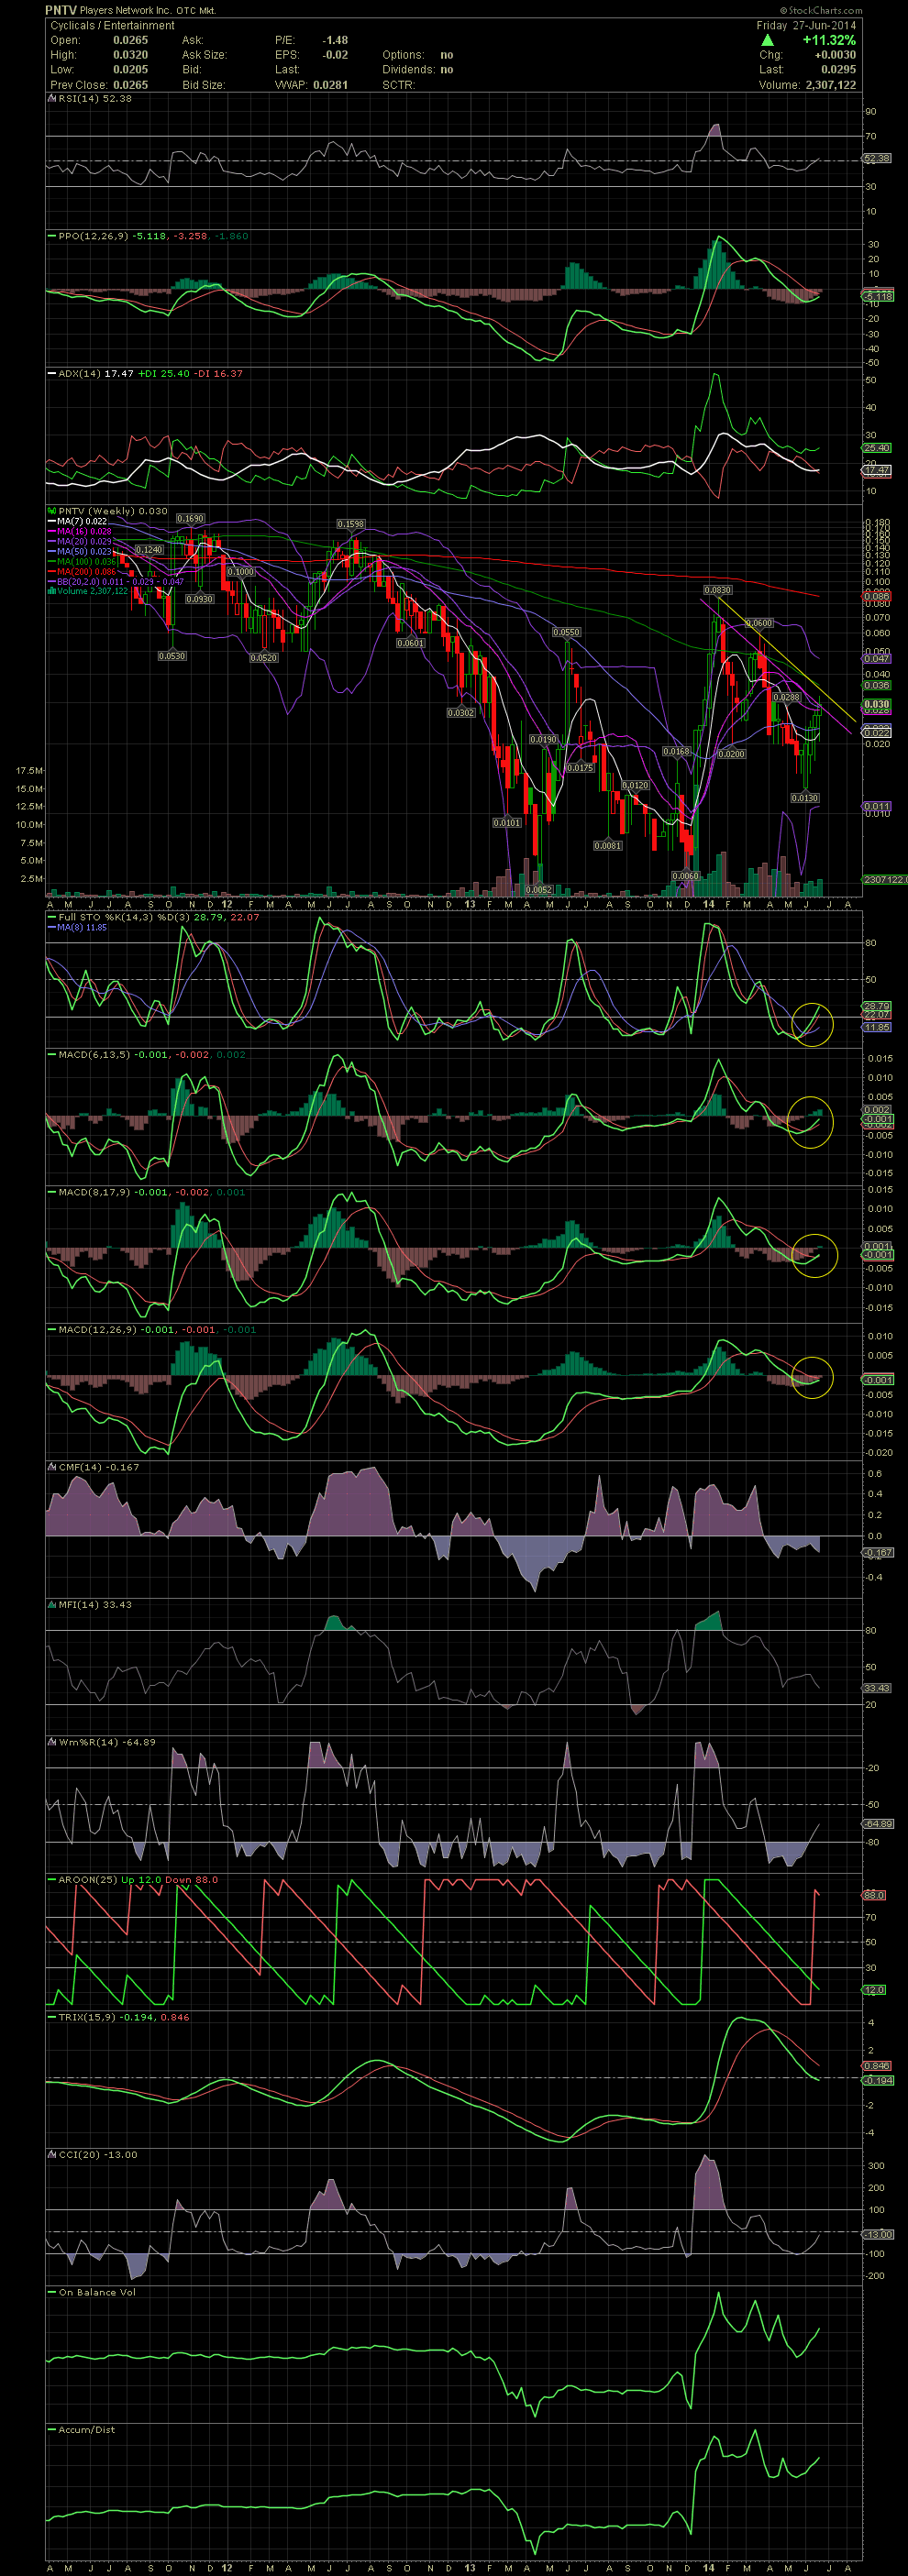
Contrary to what very few continue to argue, PNTV has actually moved up for five consecutive weeks while establishing a low at .013/.015. With a weekly chart, one can see the bigger view as to possible longer term resistance points. I typically use the candle bodies for support/resistance lines. But to satisfy those that include candle wicks/tails, here is a weekly chart with both resistance lines drawn in. Either way, both lines are close enough to use a range of .031 and .035 as short term breakout points. As I just stated in my previous post, I would hope to see a close of .035/.04 in this shortened trading week. Although not quite in total confirmation, the FullSto and MACDs on the weekly chart are close to confirming a strong move higher from the lows established on the daily chart. I can definitely see the high of .083 tested last in the year. GLTA
Contrary to what very few continue to argue, PNTV has actually moved up for five consecutive weeks while establishing a low at .013/.015. With a weekly chart, one can see the bigger view as to possible longer term resistance points. I typically use the candle bodies for support/resistance lines. But to satisfy those that include candle wicks/tails, here is a weekly chart with both resistance lines drawn in. Either way, both lines are close enough to use a range of .031 and .035 as short term breakout points. As I just stated in my previous post, I would hope to see a close of .035/.04 in this shortened trading week. Although not quite in total confirmation, the FullSto and MACDs on the weekly chart are close to confirming a strong move higher from the lows established on the daily chart. I can definitely see the high of .083 tested last in the year. GLTA
 (0)
(0) (0)
(0)