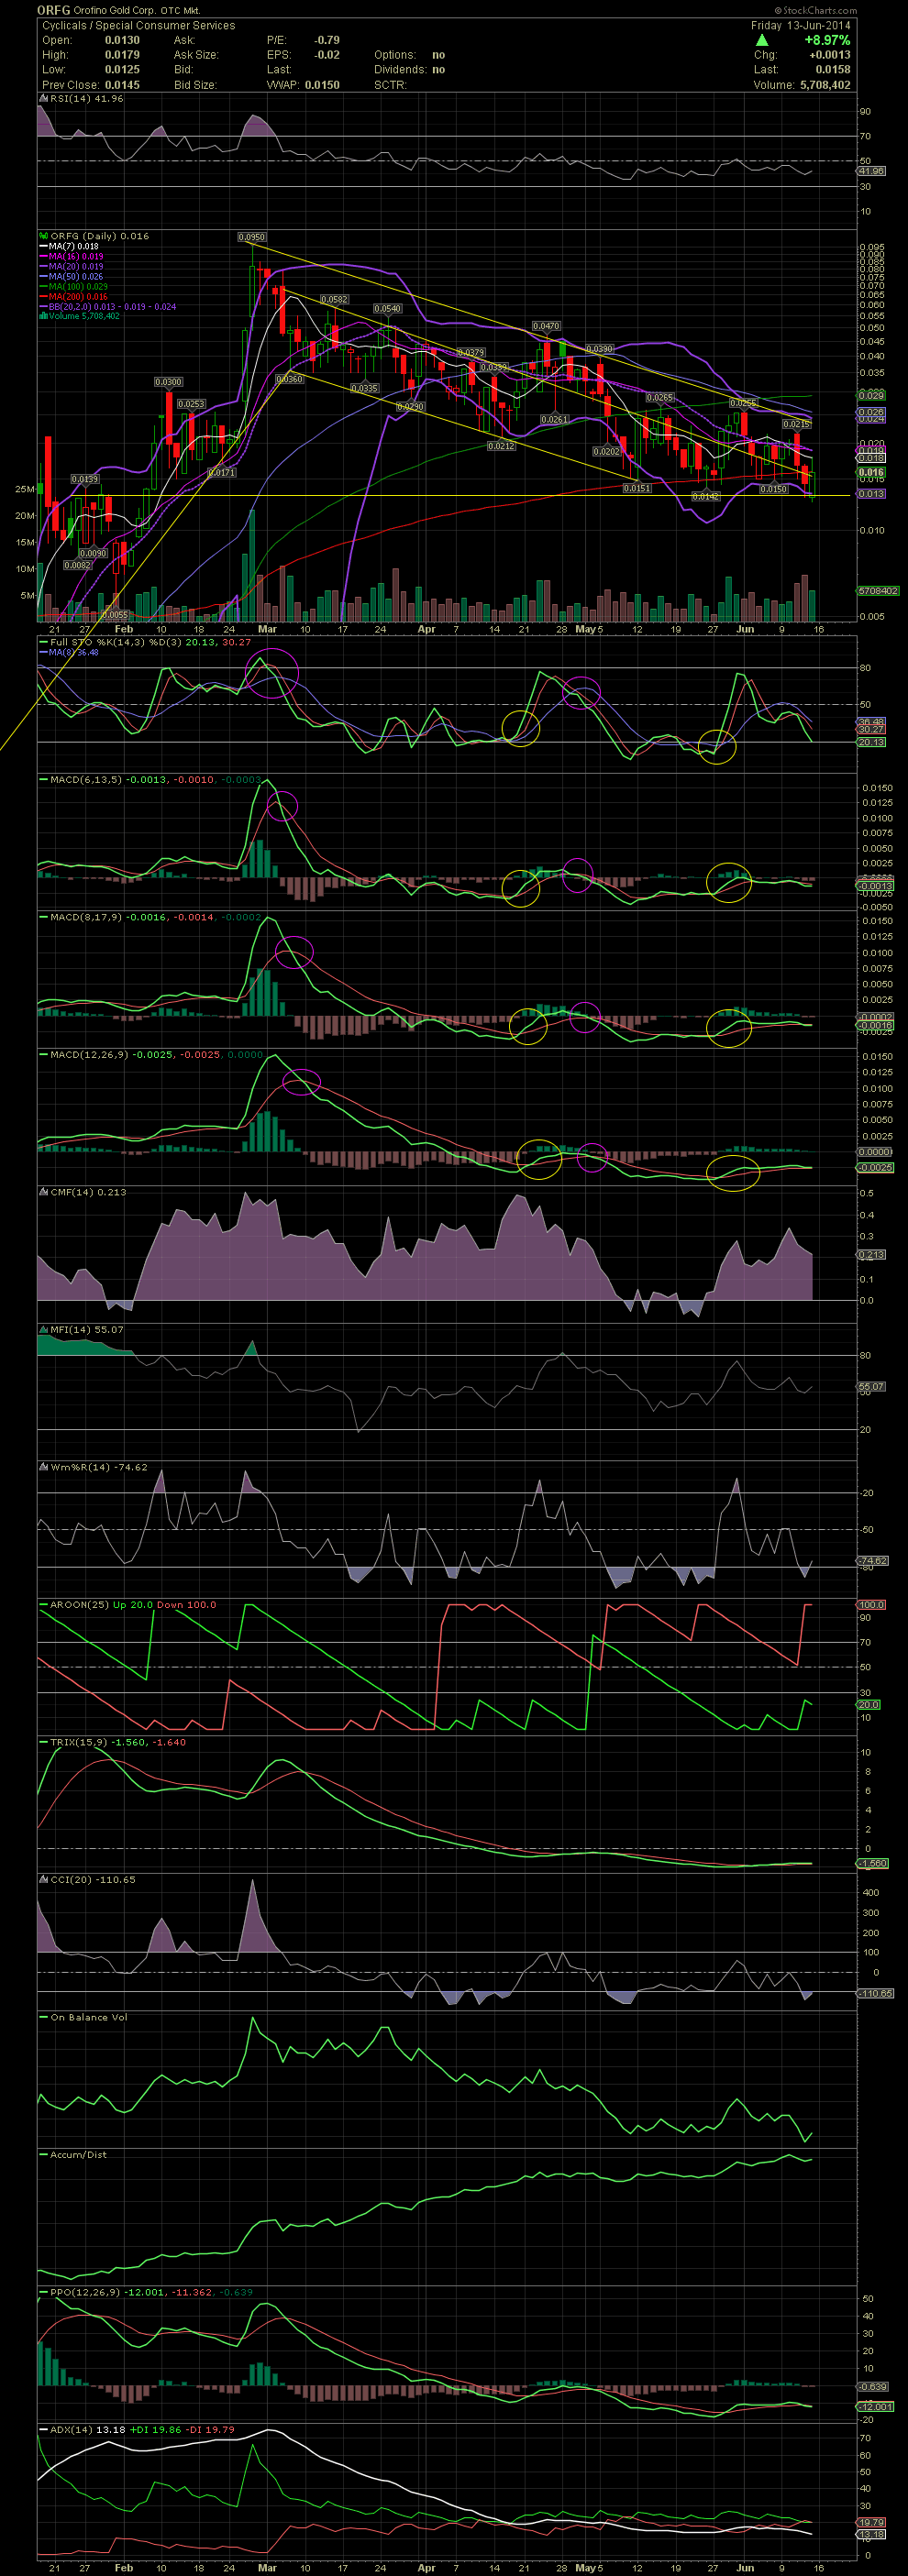
ORFG Daily Chart ~ Has It Finally Put in a Bottom
Post# of 2561

There's been a lot of rumors of huge material news on the horizon for ORFG since the stock hit .095 way back in late February. A few of us participated in a nice run for the .01s and taking profits in the .08s and .09s. The re-entry hasn't been nice. I've been attempting to catch the falling knife with friends for weeks and weeks despite the chart saying to be careful since the top. As one can see on the chart, ORFG has been in a declining channel since the top. It finally began to test the support level at .013 this week. This is a level I've had on radar as it was the resistance point of late January prior to the breakout in early February. There have been a few swing trades from bounces off of the lower channel line. The intraday reversal on Friday was a good indication that a low might have been established on Thursday and Friday. We'll need some follow through Monday and Tuesday. A break above .0215 would be a good start. As I mentioned previously, a close above .0255 would signify an overall reversal because of finally breaking above the top line of the declining channel. I added again this week and more on Friday at .015. Many friends have hit the stock hard this week purchasing millions of shares between themselves. We'll see what happens over the next week. GLTA

 (0)
(0) (0)
(0)