PNTV Daily Chart ~ Appears Ready for a Breakout
Post# of 2561
Posted On: 06/15/2014 12:58:08 PM

PNTV Daily Chart ~ Appears Ready for a Breakout
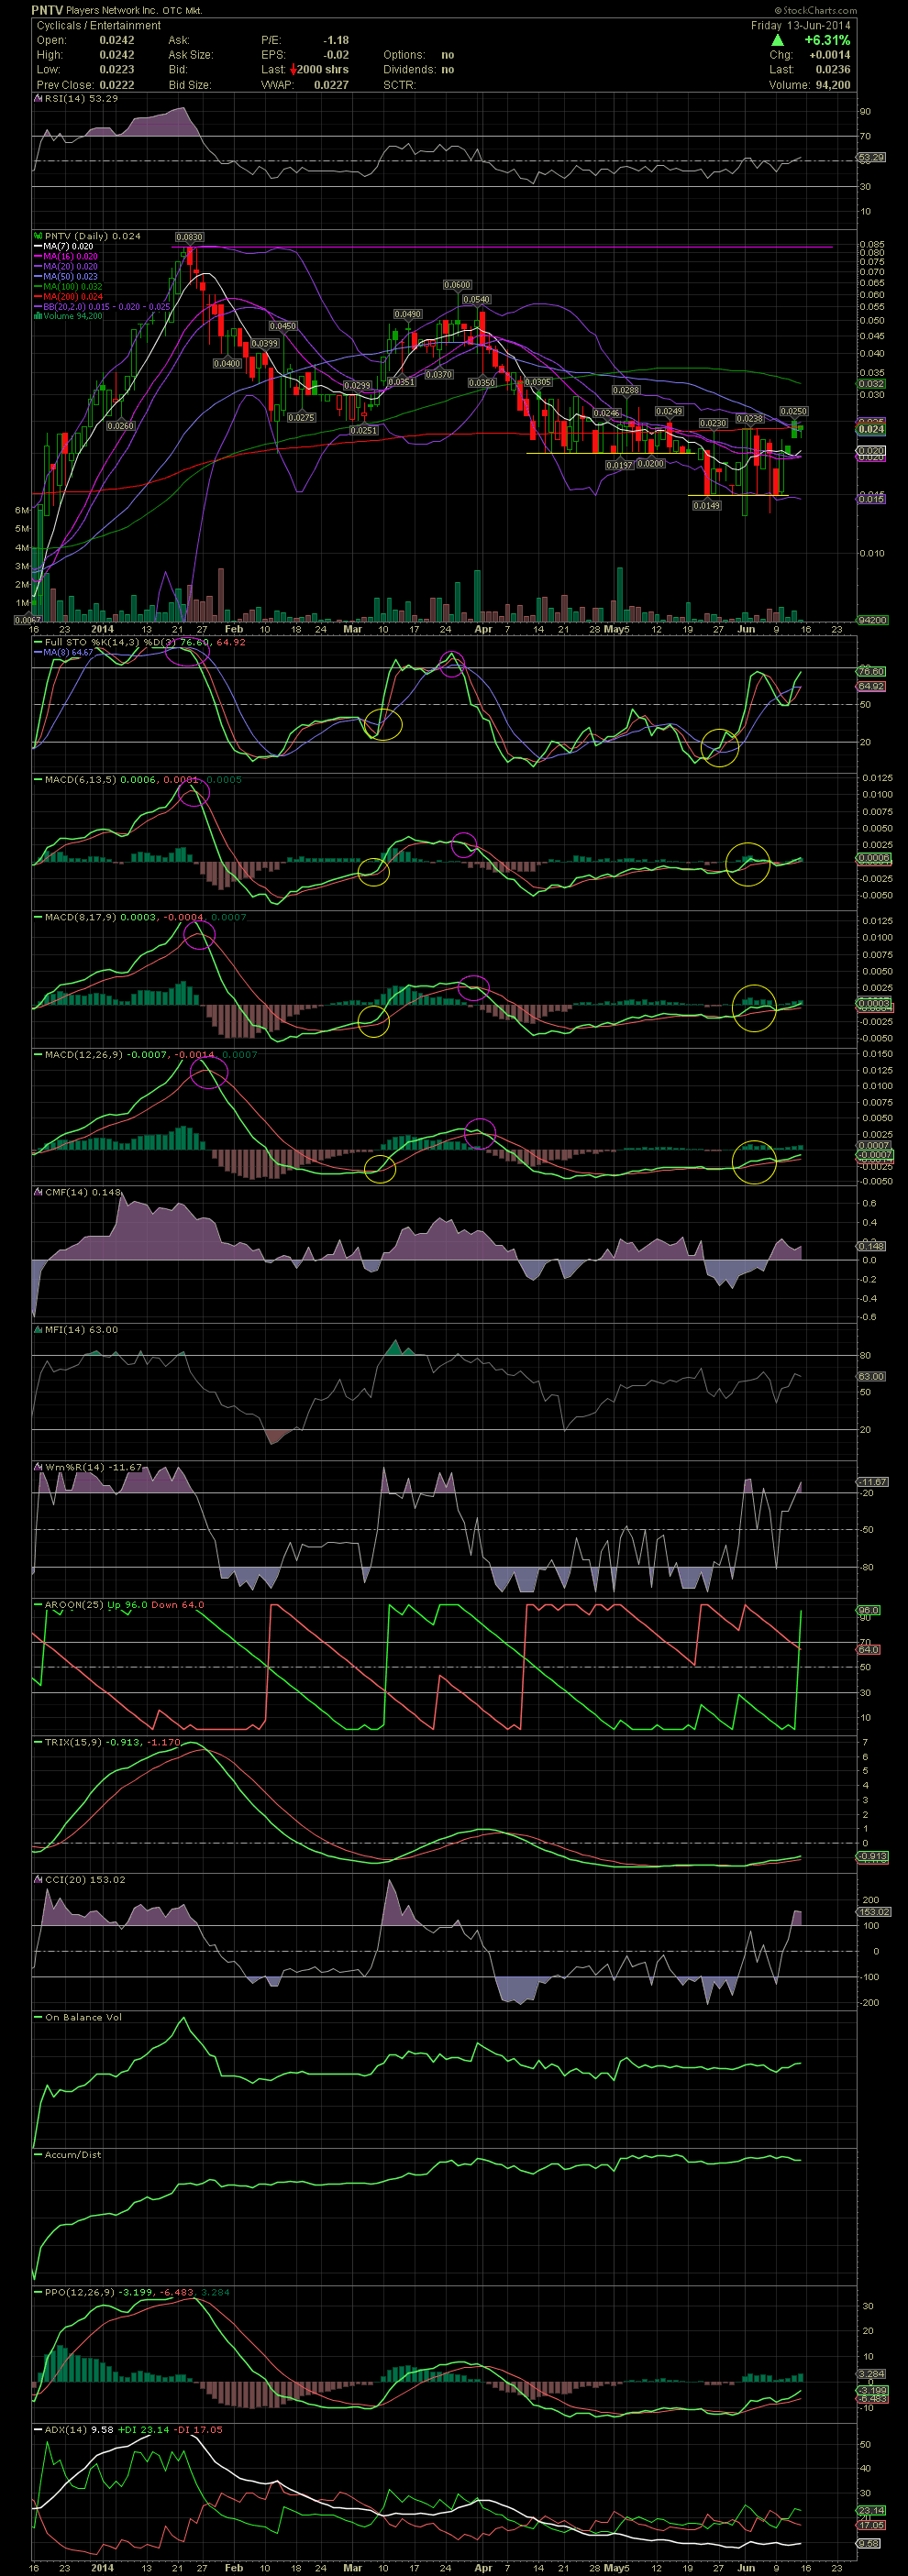
PNTV has now bounced off a 2.5 week support level and is up approx 60% from there. Over the last few weeks, PNTV shareholders witnessed a drop below the .02 level which acted as support from mid April to mid May. During this period, one can easily see the resistance in the mid to high .02s during the churning between .02 to .028 on the chart. Since then, the stock has risen from a support level established at .0149/.015 and has seen two attempts to break and close above the MA200, which is currently at .024. Friday's close at .0238 was just below that moving average. The MA50 is currently at .023 but declining, reflecting the drop in share since the of .06 in late March. The MA50 will begin to level out of the next few trading days as the higher levels of this 50 day average begin falling out of the equation. A close of .025/.0255 will set off a few alerts from technicals traders who scan for and follow stocks that close above their 50 and 200 day moving averages. Once this occurs, the MA100, which is currently at .032, would be the net target of resistance. Should the MA100 be taken out, then I would expect the .05 to .06 highs of March. The MACDs continue to creep higher with minor separation while moving to the upside upside. Once all three cross over the zero line, I would expect to see some strong divergence between the signal and indicator lines. Additionally, the RSI is at its highest number since March and on the rise. Although a few lagging indicators aren't there yet, I'm positive on the short term potential for the stock.
As PNTV is working its way out of the debt conversions that have plagued the company and share price over the last two years, the new direction of management gives real promise of much a higher share price over the coming weeks. On a technical basis, I'm personally looking for a test of the .05-.06 area over the next 30-60 days. Looking at a longer term chart, it's my opinion that when the .06s are surpassed, a test of .083 will come quickly. Any solid material developments from the company, and my hopes are for a return to the mid teens could be seen later this year into early 2015. GLTA
 (0)
(0) (0)
(0)