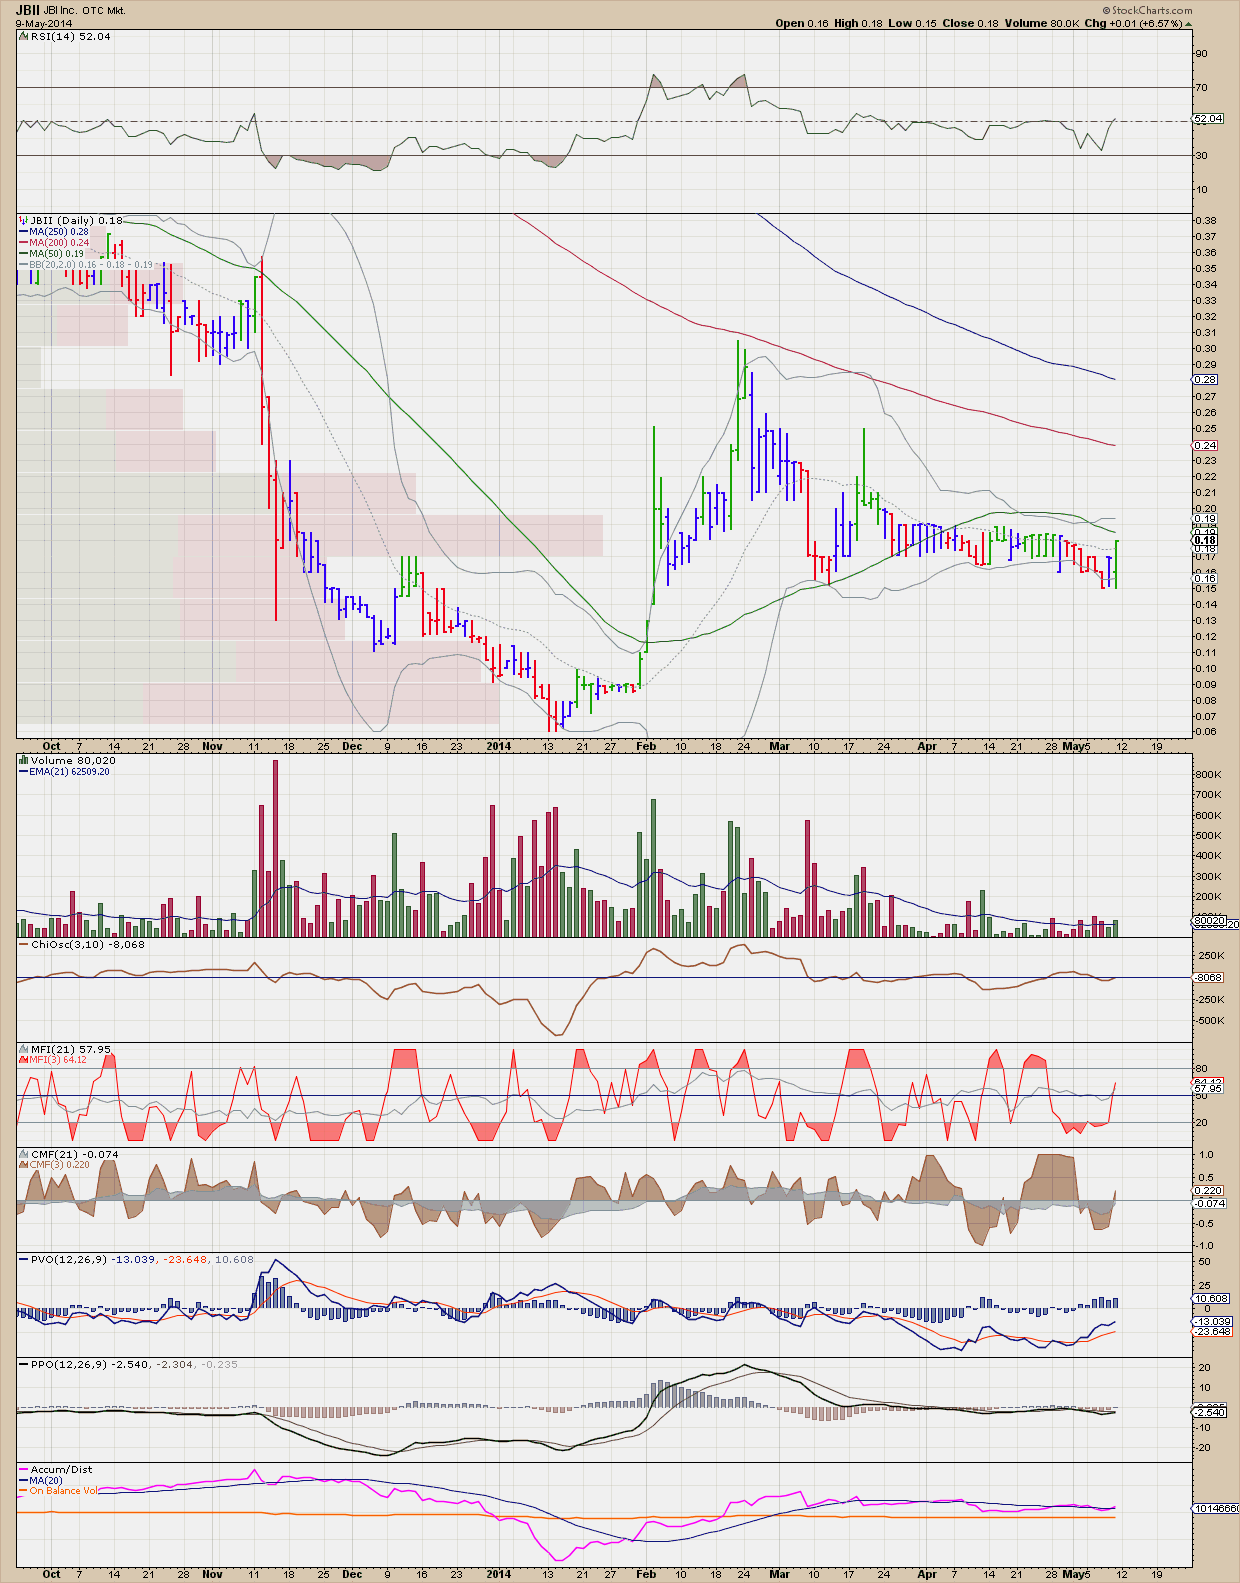
Before the last sell off to 6 cents, look at how similar the situation is. The price bars open, high, low, close and proximity to the 50 DMA. 10K early next week maybe? Good news and we break up through the 50, bad news and another sell off? Could go either way I just think the chart has given an opportunity for volatility.


 (0)
(0) (0)
(0)
 (0)
(0) (0)
(0)