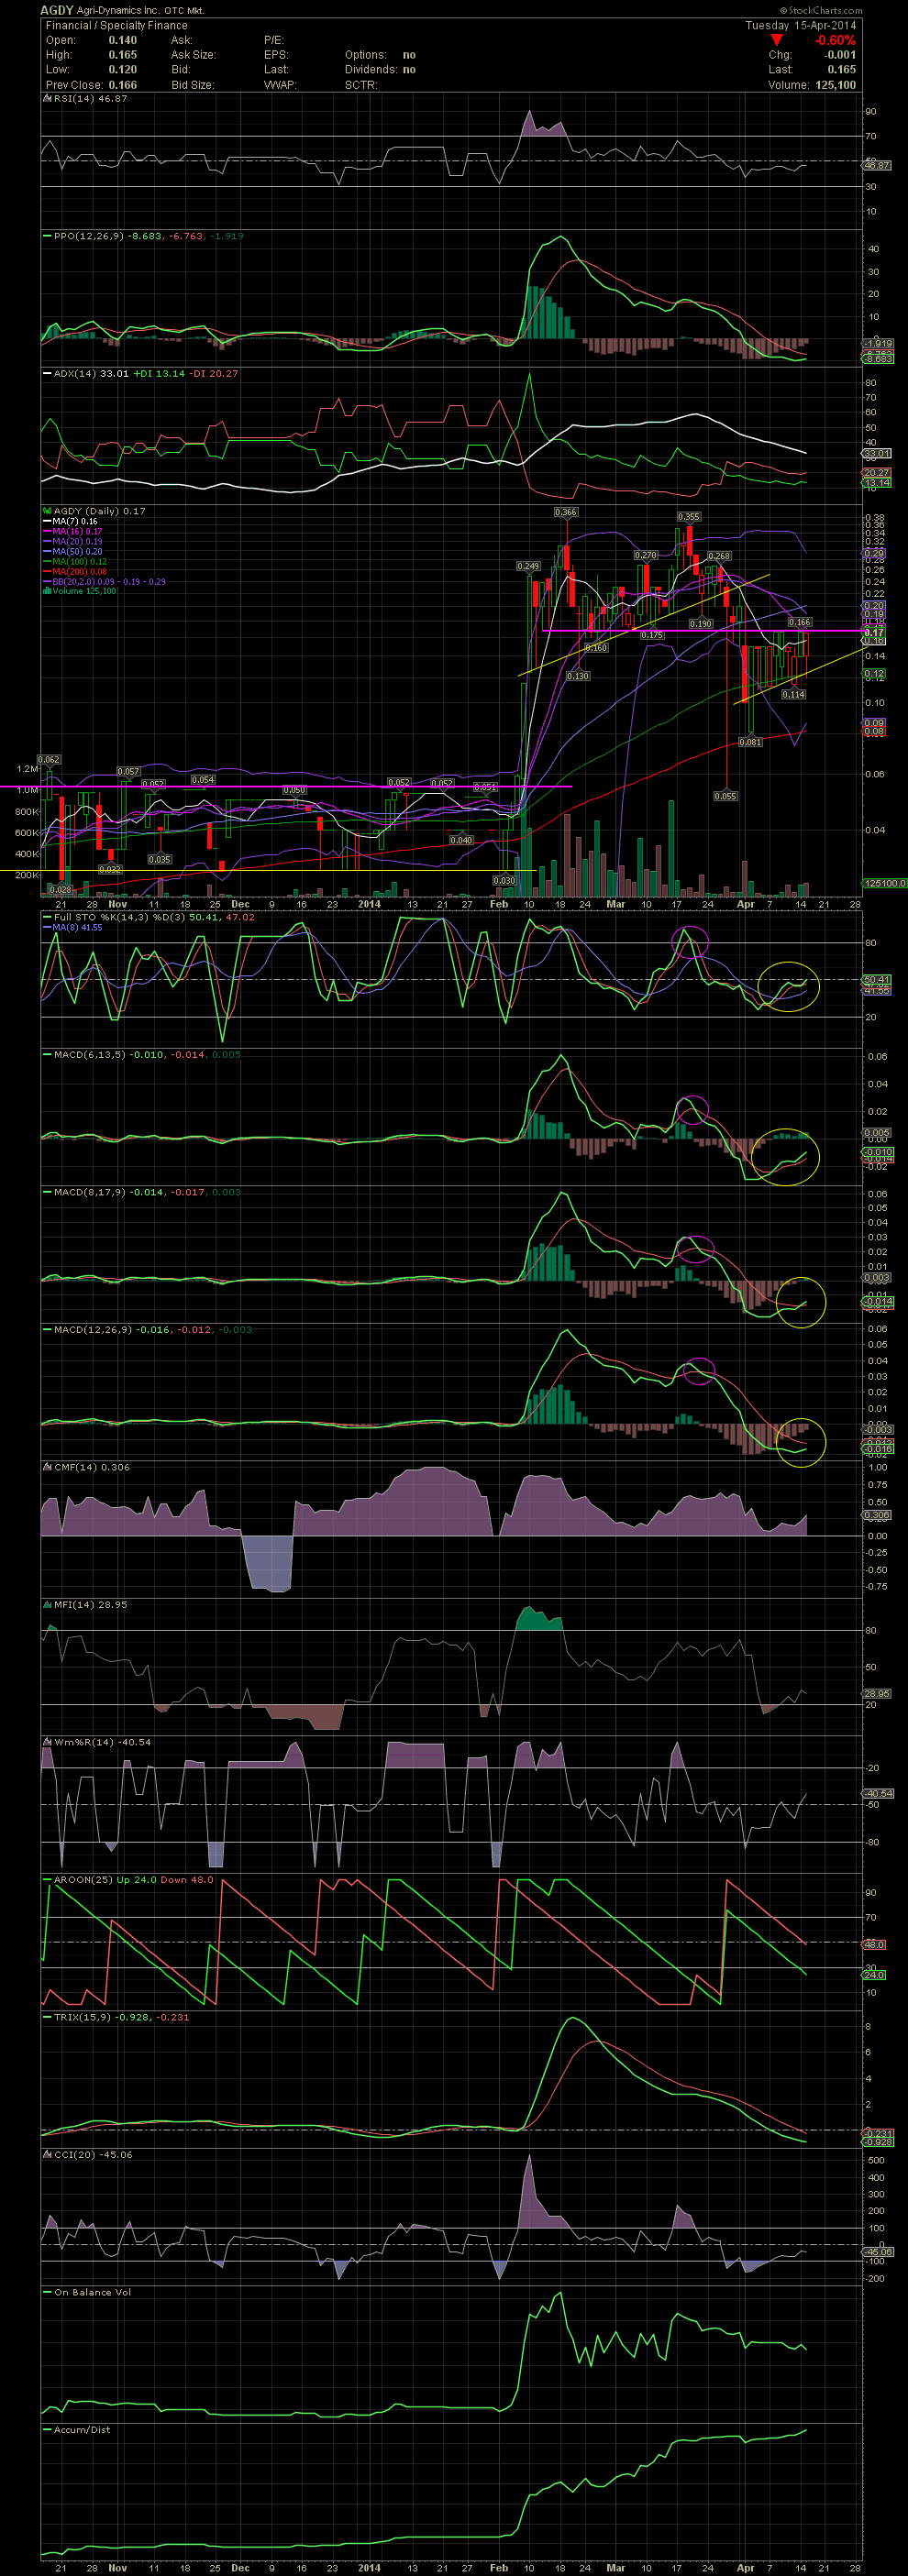
AGDY Daily Chart ~ Great Set Up The chart and
Post# of 2561

The chart and technicals for AGDY have reset nicely since the decline from the breakout of .03 to the mid .30s in early February to mid March. A quick look at the FullSto and MACDs shows three out of four having crossed over to the positive. The stock's lows have been rising gradually rising over the last two weeks as the stock has been hugging the MA100. Any material news over the next few days and AGDY will more than likely run to new highs as this stock has 9.4 mil in the float which is held by very few shareholders. GLTA

 (0)
(0) (0)
(0)