INDU Daily Chart ~ Downtrending Towards the MA200?
Post# of 2561
Posted On: 04/13/2014 11:31:29 AM

INDU Daily Chart ~ Downtrending Towards the MA200?
As most of you know, the big boards, including the Dow and S&P, are much easier to call with charts and technicals than the highly manipulated penny stock arena. When there are billions upon billions of dollars/shares traded on the big boards, it's almost impossible to fabricate and manipulate the charts as it is with the penny stocks. So when a big board stock, or the major indices, show a turn in direction and momentum, it is typically developing over a few days or weeks rather than in a very short period as with the OTC stocks.
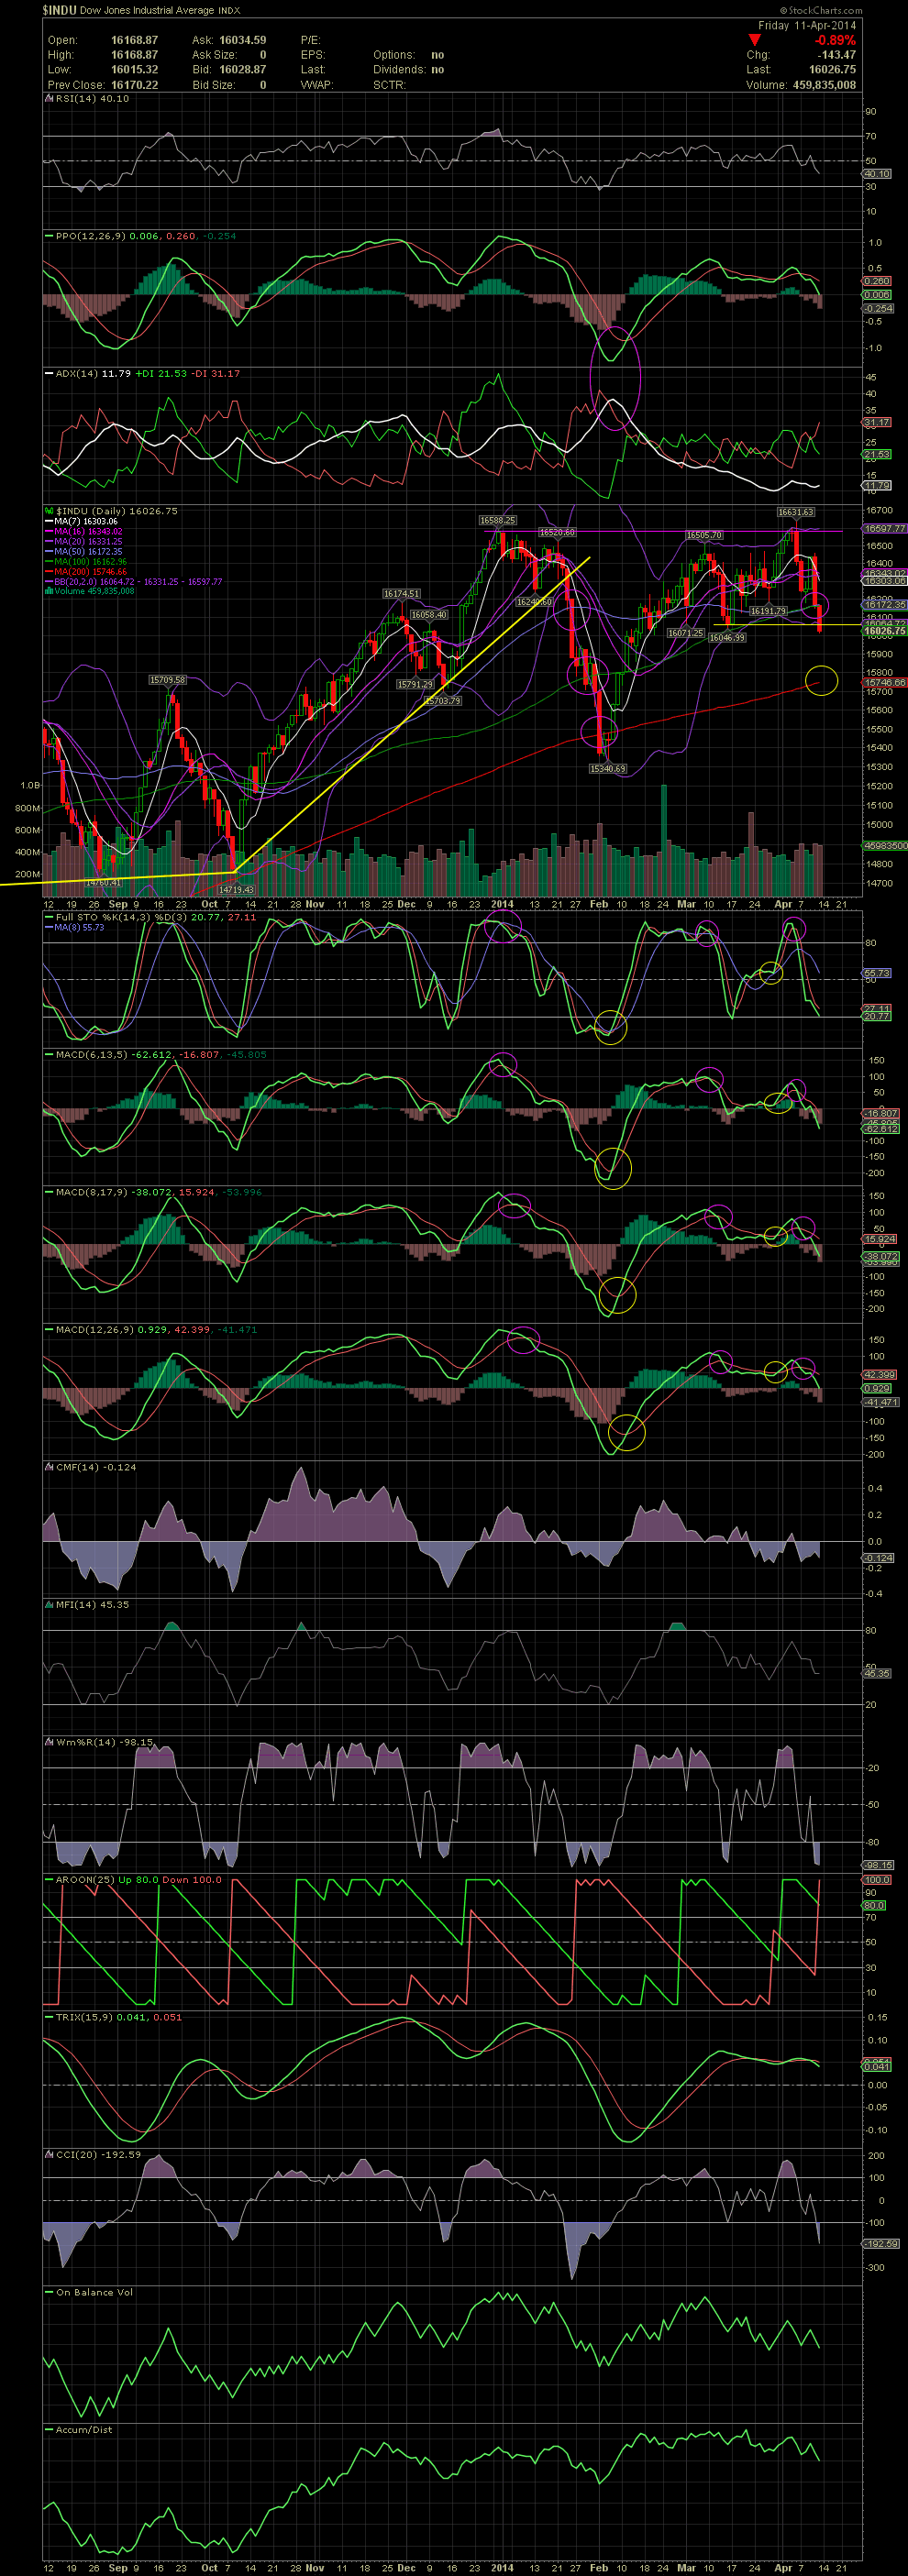
All the indicators friends and I use are on the following INDU chart. That includes the various moving averages and bollie bands along with all the technical indicators underneath the chart. Note the crossovers, in both directions, of the FullSto and MACDs. They are very good tools to use in timing the market, especially when a stock gets overbought. One never can project how fast or far a stock might selloff, but the idea is to protect your capital when a sell signal occurs. Whether a stock simply trends sideways, pulls back, or declines sharply is an unknown. But being able to use the indicators to sidestep a huge and expensive selloff is not that difficult to avoid. The chart below has a lot of technical information on it if one knows what to look for as trends develop. The most recent was the double top and the negative curling and crossovers of the indicators a few days prior to the acceleration of the decline. Although only 600 points so far, who knows if the INDU is going to hold here, at a previous low, or continue down to the MA200. If that doesn't hold, I would be looking for a test of the previous low at 15,340. We'll see what happens shortly. GLTA
As most of you know, the big boards, including the Dow and S&P, are much easier to call with charts and technicals than the highly manipulated penny stock arena. When there are billions upon billions of dollars/shares traded on the big boards, it's almost impossible to fabricate and manipulate the charts as it is with the penny stocks. So when a big board stock, or the major indices, show a turn in direction and momentum, it is typically developing over a few days or weeks rather than in a very short period as with the OTC stocks.
All the indicators friends and I use are on the following INDU chart. That includes the various moving averages and bollie bands along with all the technical indicators underneath the chart. Note the crossovers, in both directions, of the FullSto and MACDs. They are very good tools to use in timing the market, especially when a stock gets overbought. One never can project how fast or far a stock might selloff, but the idea is to protect your capital when a sell signal occurs. Whether a stock simply trends sideways, pulls back, or declines sharply is an unknown. But being able to use the indicators to sidestep a huge and expensive selloff is not that difficult to avoid. The chart below has a lot of technical information on it if one knows what to look for as trends develop. The most recent was the double top and the negative curling and crossovers of the indicators a few days prior to the acceleration of the decline. Although only 600 points so far, who knows if the INDU is going to hold here, at a previous low, or continue down to the MA200. If that doesn't hold, I would be looking for a test of the previous low at 15,340. We'll see what happens shortly. GLTA
 (0)
(0) (0)
(0)