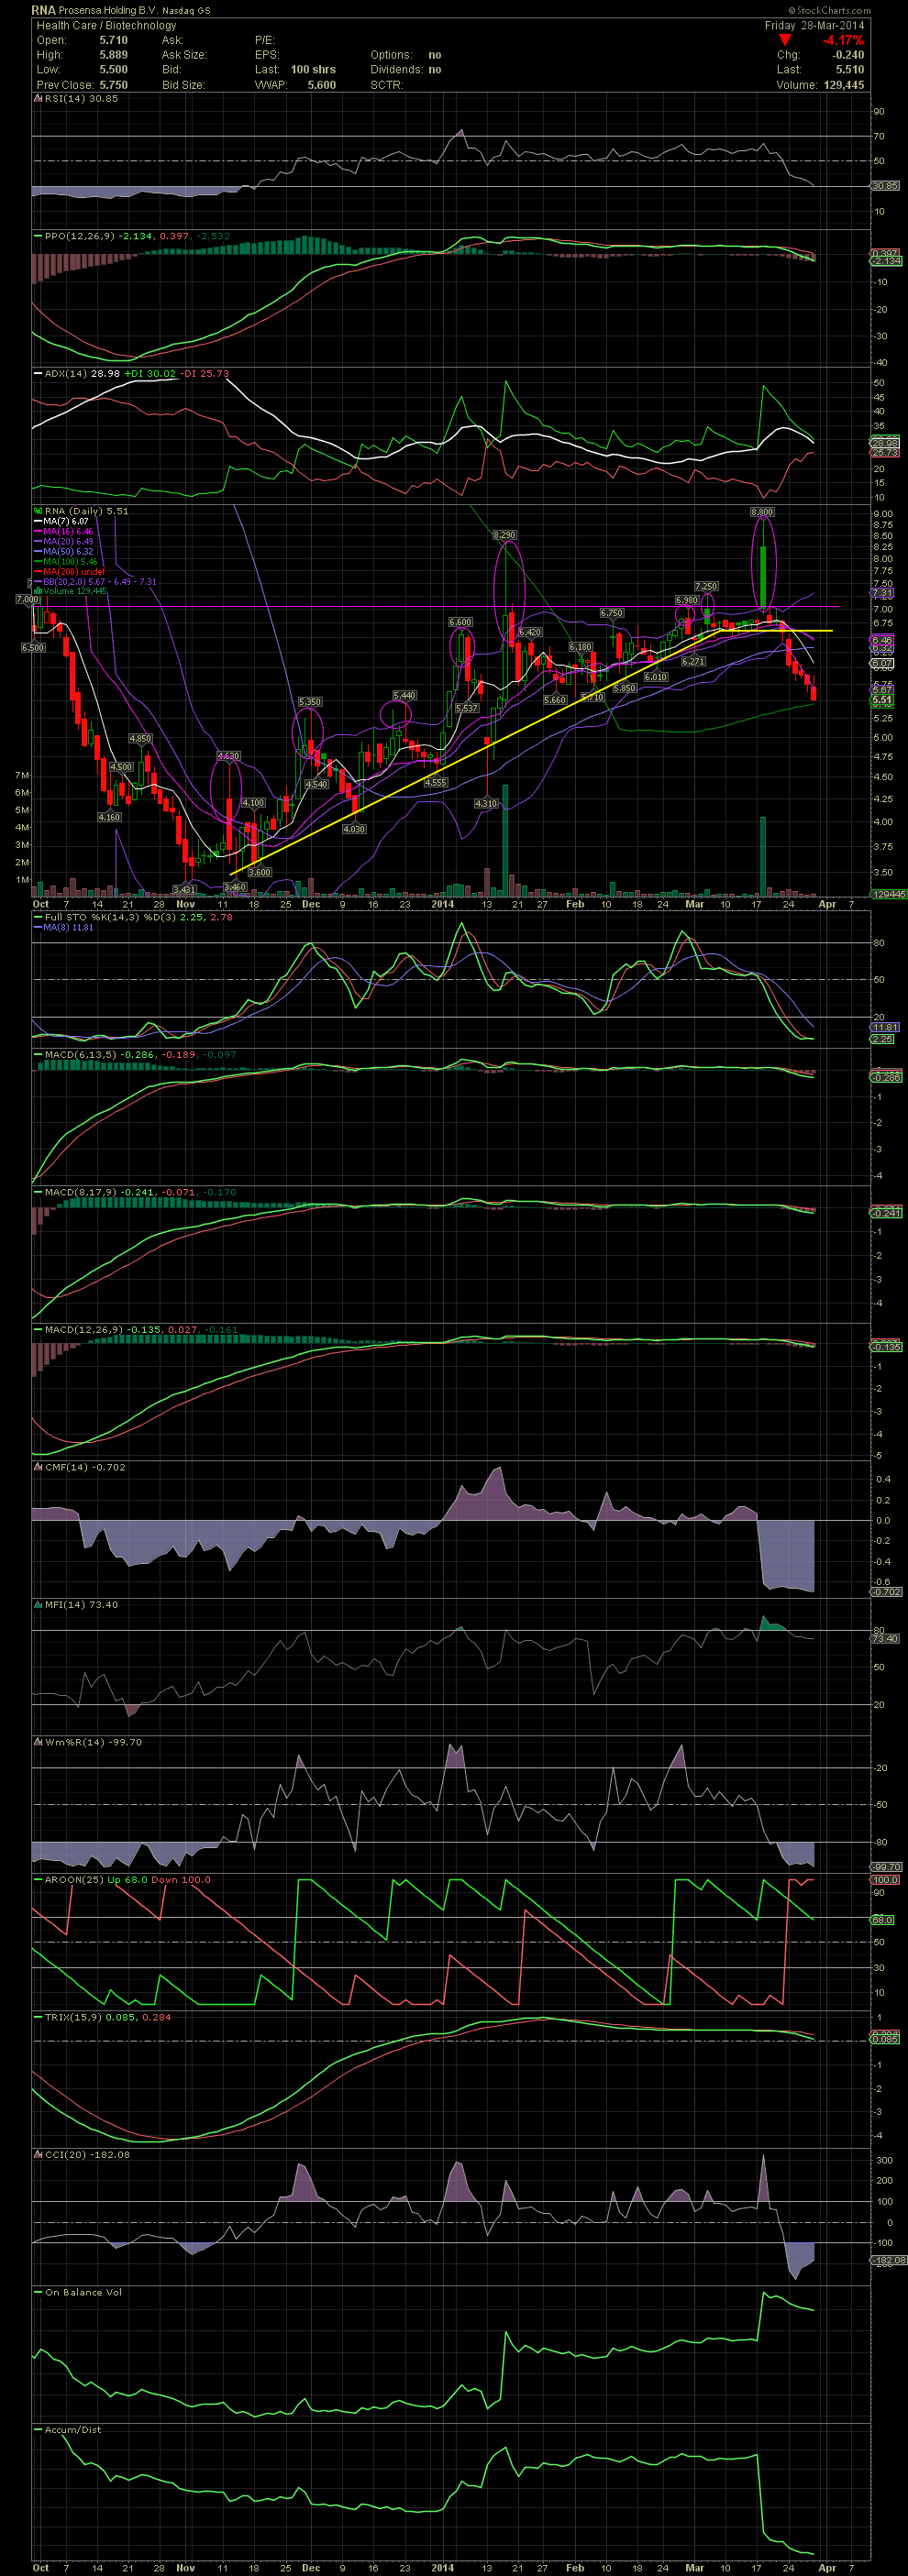
$RNA Daily Chart ~ On March 23, I posted a char
Post# of 2561
On March 23, I posted a chart and my thoughts of RNA. I mentioned that I saw nothing on the chart that interests me (link back for our sales while the stock was way outside the upper bollies). The stock had closed at 6.59 on March 21. On Friday, just seven days later, we see the stock at 5.51. The break of the lower channel line, after losing the multi month rising support line, resulted in a sharp selloff. After slicing through the MA50, the stock quickly headed towards the MA100 at 5.46. I still see nothing here that is of interest, but I'll keep RNA on watch. The stock does move and is great for swing trading when the chart is set. GLTA

 (0)
(0) (0)
(0)