Then.....applying the fact that shares issued and
Post# of 1352
Posted On: 03/30/2014 5:52:12 PM

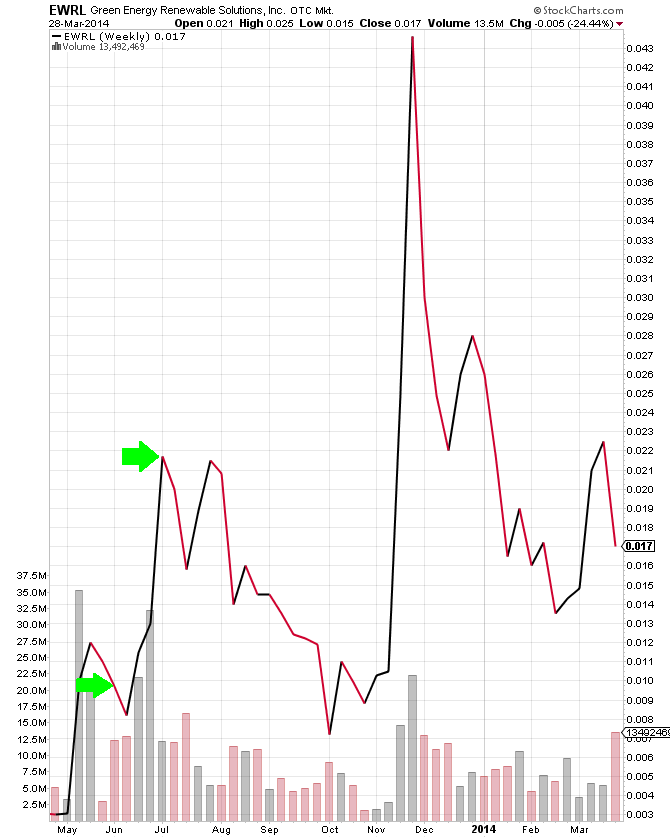
Then.....applying the fact that shares issued and shares sold into market are separate. If you look at July....51,808,291 was the total amount of shares traded....and only 5,700,000 shares were issued for convertibles . That comes to only 11% of all shares traded. Taking 11% and 30%....the average for those two months equate to 20.5%. Refer to the chart for those two months:
Refer to previous:
http://investorshangout.com/boards/message?id=1381983
Most importantly:
http://investorshangout.com/boards/message?id=1376887
So let's just round that 18.7% figure up to 20%. That is a simple way to look at things. When volume is lower more so than higher....capitulation becomes your advantage. It isn't a one day event....it is spread out. When volume dries up....many start to sell out...and capitulate..........add in shares being sold into the market after issue...and you have your target capitulation moment....mmmm..mmmmm......good. Remember.......shares being sold into market after issue tend to be more static than not(in this case). Volume tends to be less static ..........apply volatility.......and that is why Black – Scholes is used .
Average monthly volume for past 10 months(two weeks over) is 46,300,000. Lowest monthly volume in September > 22,490,215. The highest monthly volume in May > 65,470,814. That is a rough 300% swing. The closing share price has a rough 1000% swing (just plain nuts!!).
Sorry........rambling a bit here.....just love playing with numbers...........they tell you things.
 (0)
(0) (0)
(0)