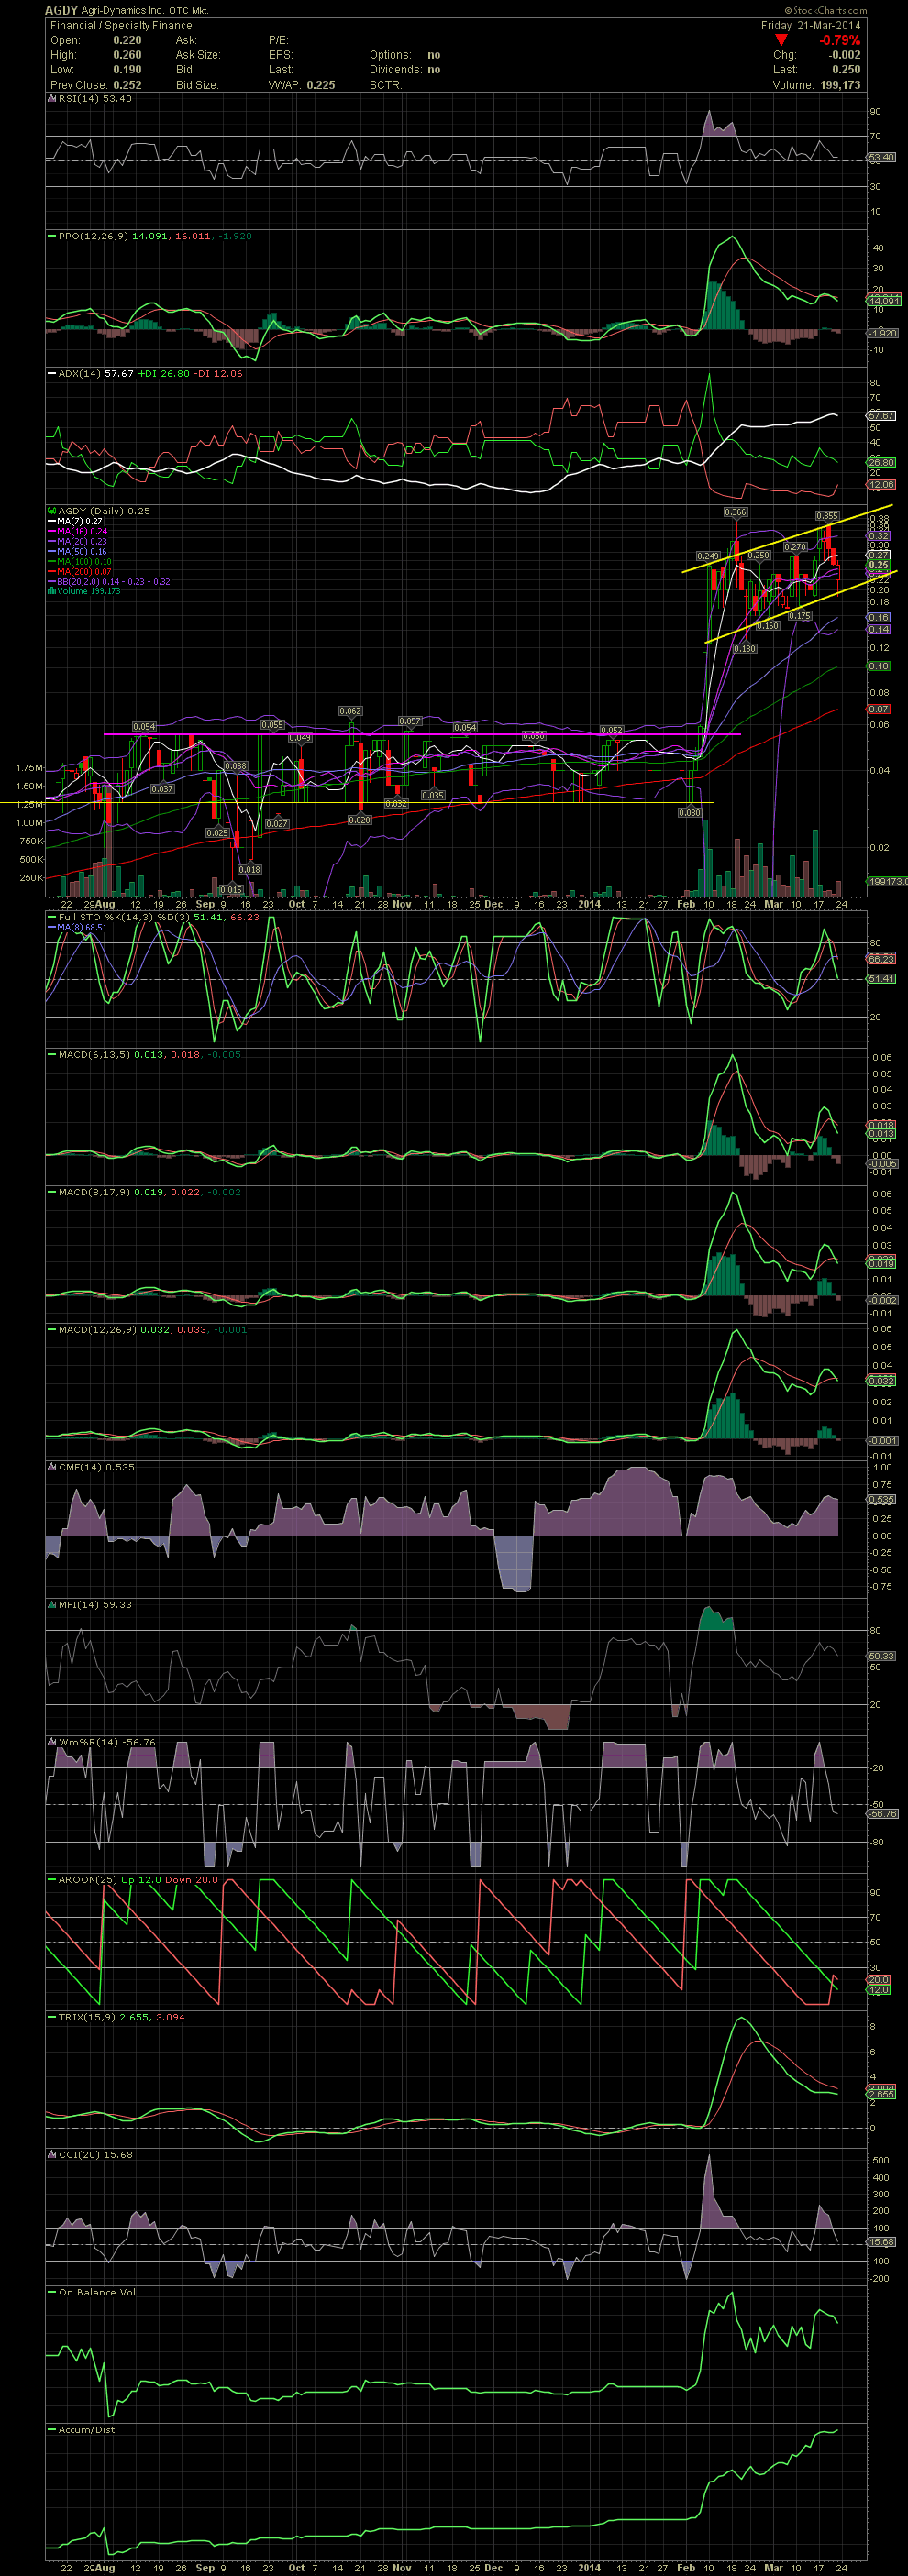
AGDY Daily Chart ~ Trending Higher in a Rising Cha
Post# of 2561
Since the breakout of the six month, sideways channel at .05, AGDY has settled into a rising channel formation which is gradually seeing the stock hit higher lows and higher highs, with the exception of the initial pop to .366. Of interest to me is that six weeks ago, AGDY closed at .249 after a tremendous five day move which began at .03. Today, six weeks later, the stock is sitting at .25 under going great consolidation while the FullSto and MACDs have been resetting. The stock undoubtedly picked up a lot of flippers who joined the momo after the stock executed a 12 bagger from the Feb 4 low of .03. Unfortunately for most of them, the stock has been trending and gradually sucking out longer term profit takers along with the short term flippers since the stock has stalled in the .20s with just three days of higher trading in the .30s. Strong rumors persist of imminent news, although that's been expected for approx two weeks now. While the stock has been trading over 1 million shares per week in five of the last six weeks, it's interesting to note that hardly any of the larger shareholders have sold a share. So my guess is that the shorts/MMs were caught off guard with that early February run, and are now scrambling to cover their being on the wrong side of the fence. Last week saw at least nine 100,000 share buyers on the bids as a couple of groups decided to take positions in the stock. If this rising channel line holds early on this coming week, I would expect a move towards new highs at the upper end of the channel by the end of the week. GLTA

 (0)
(0) (0)
(0)