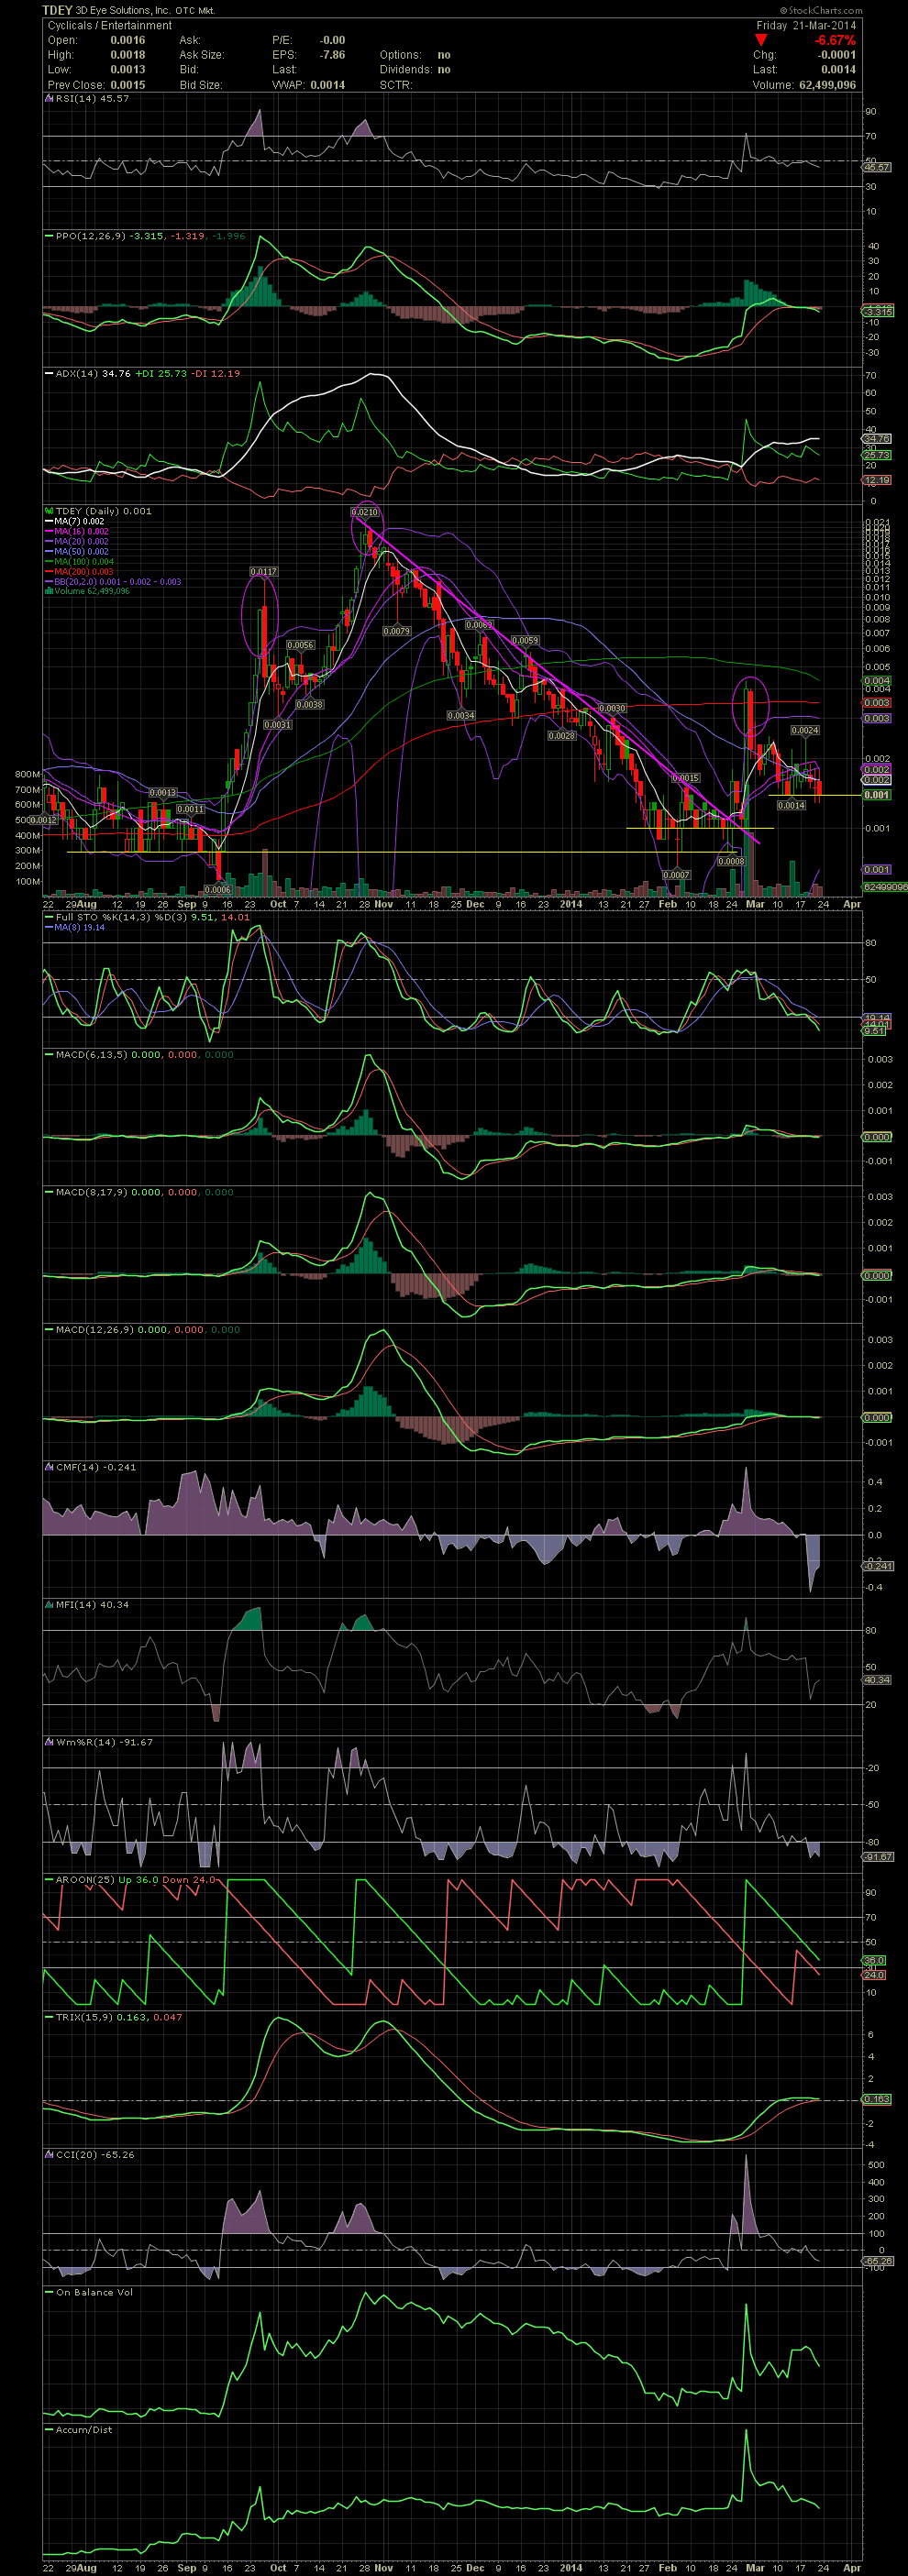
TDEY Daily Chart ~ Still Trying to Base and Revers
Post# of 2561
Another week passed, and nothing has really changed for the chart and technicals on TDEY. The FullSto has entered slightly oversold levels, but the MACDs are offering no help as they have flatlined for now. Normally I wouldn't post a chart when nothing has changed, but I've received more requests for a TDEY chart this week than any other stock. Let me first say, a chart doesn't make a stock move. A chart is to review historic trading patterns and give one a sense of the trading targets in either direction. A chart won't tell you when a move will occur though. You have to wait for that to happen. The extremely obvious exit point was three weeks ago during the one day explosion from .0009 to .004s. In addition to being way outside the upper bollie, the stock also slammed into the MA200. I did trade off a few but no where what I should have done. So the simple penalty for not following a plan, is to ride one's position back down to where it used to be. I hate when I do that! Anyway, TDEY needs to get on its horse and begin riding. Same as before, the stock needs to close above .0024 in order to give a confirmation of a breakout. Until that occurs, those flipping between .0014 and .0024s will do very well. GLTA

 (0)
(0) (0)
(0)