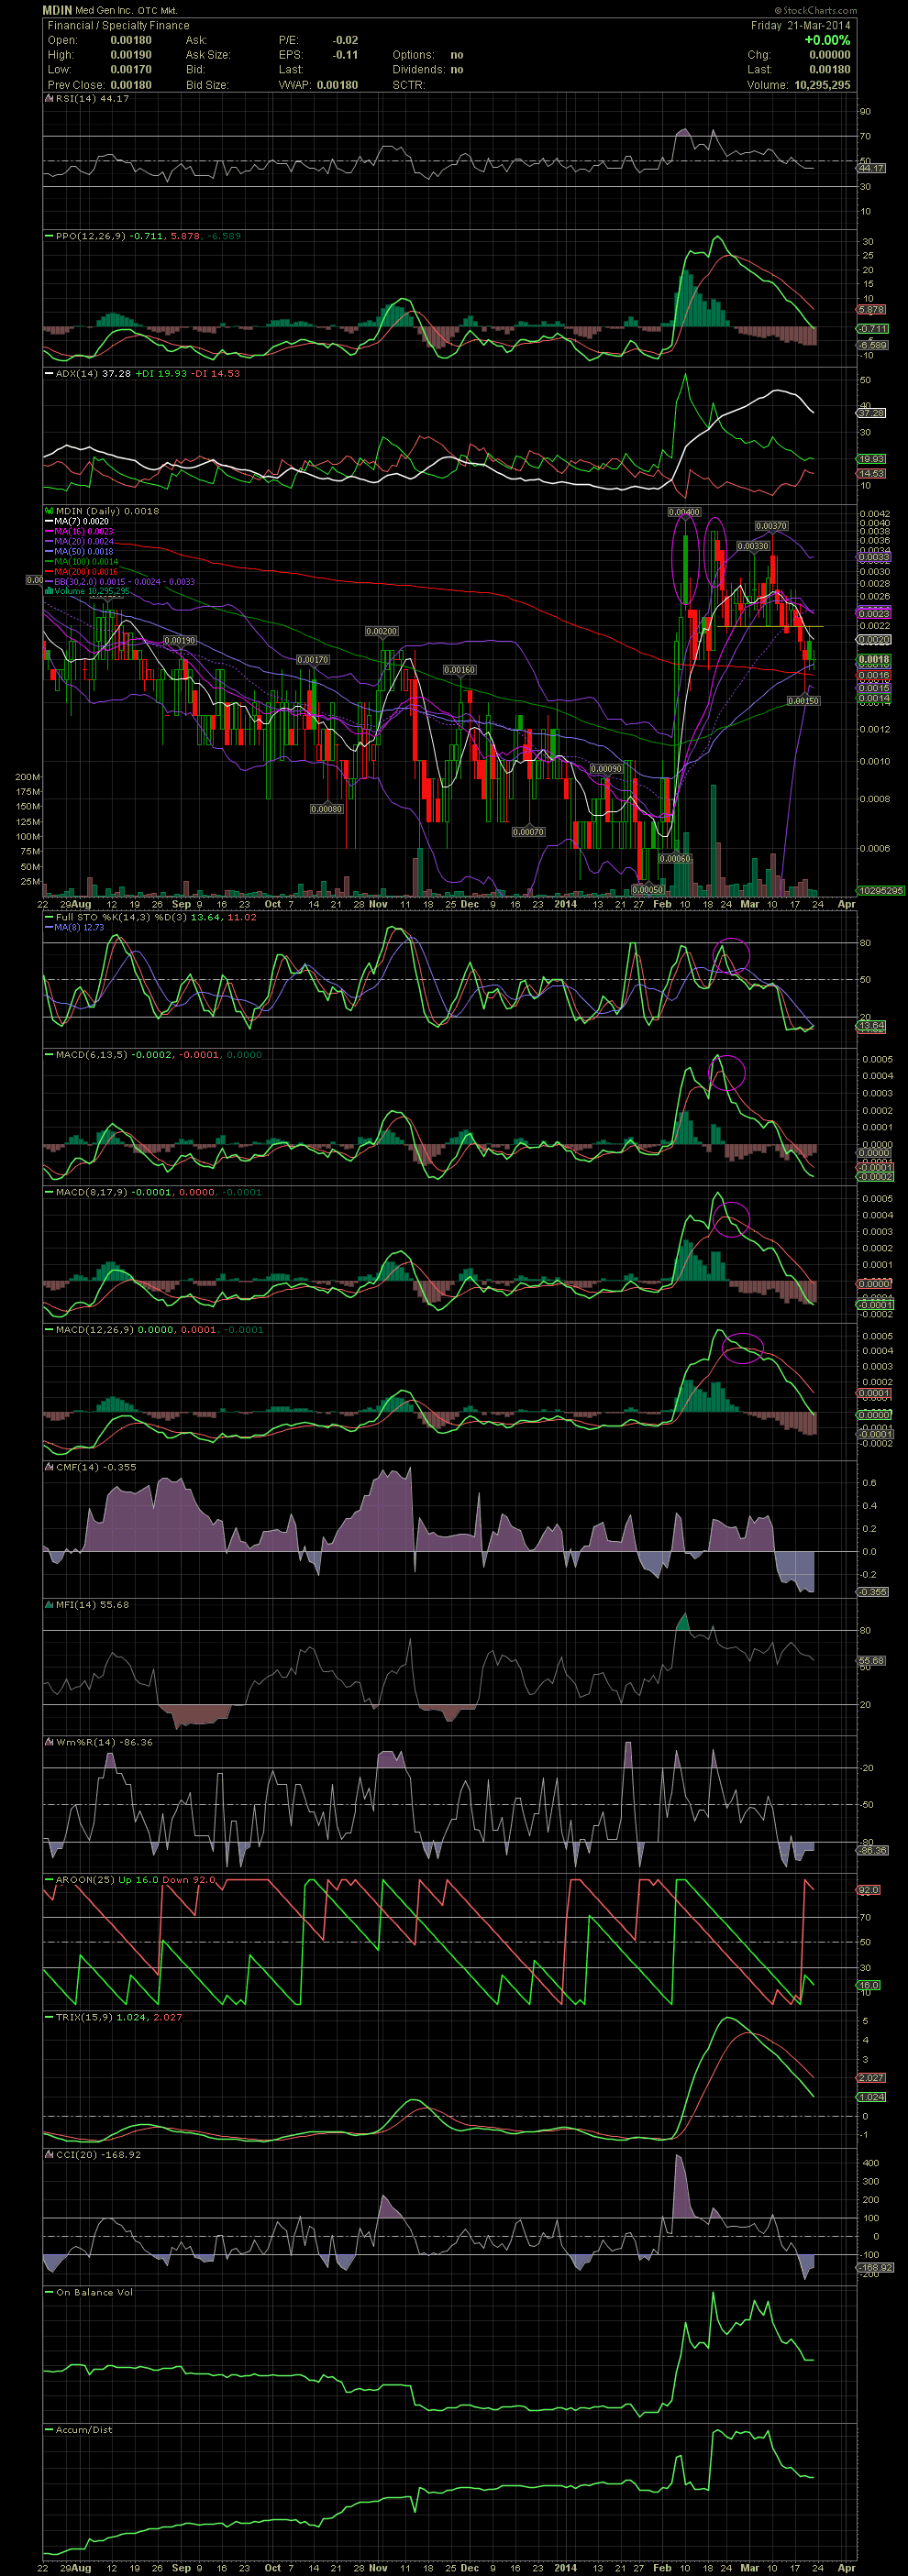
MDIN Daily Chart ~ Sell Signal Three Weeks Ago I
Post# of 2561

I received a few requests for a chart on MDIN. I've never been in MDIN, but I always get a question or two about MDIN in PMs. As I mentioned to a couple of individuals 2-3 weeks back, MDIN's technicals, mainly the FullSto and MACDs crossed to the sell side three weeks back (see circled crossovers below). Since then, the stock attempted to hold its then support line but fell below it last week to find some short term support at the MA50 and 200. I was asked whether I believed that the golden cross of last week might lift the stock. I don't hold much faith in the golden cross, namely because if you waited for the GC, you would have missed the entire move in early Feb. The GC is a lagging indicator based on the moving average of the share prices going back 50 and 200 days. When it comes to penny stocks, since they are so heavily manipulated in both directions, I personally don't place any weight on the Golden Cross. You need to focus on the shorter term indicators when trading the pennies. If MDIN closes below the .0018 level, there could be some swift downside ahead. That was the support immediately after the early Feb run and only for the last three days. Hopefully for those holding, you'll get some news to reverse the current negative trend of the indicators. GLTA

 (0)
(0) (0)
(0)