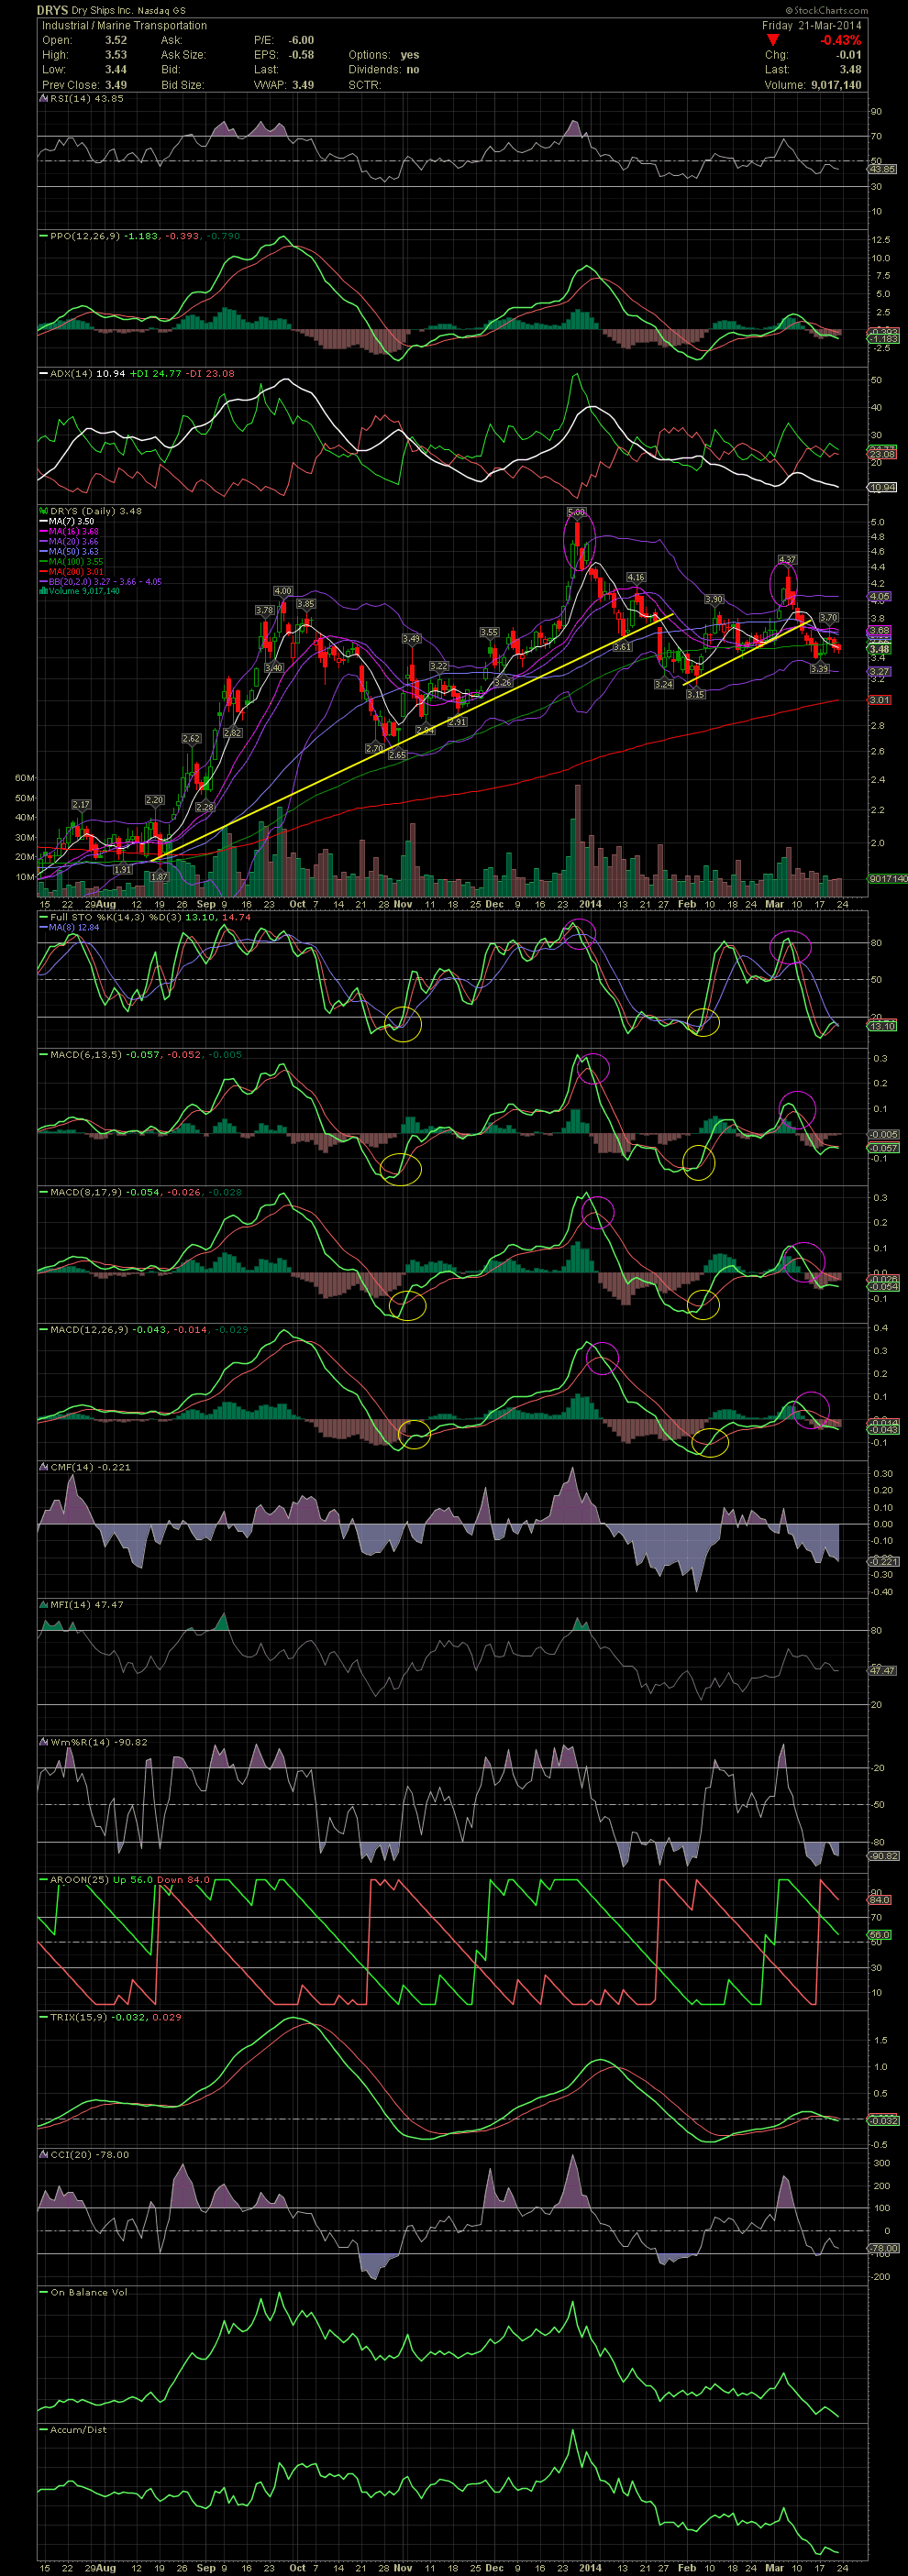
DRYS Daily Chart ~ Needs to Hold 3.39/3.40 DRYS
Post# of 2561
DRYS is trending downwards since the pop outside the upper bollie two weeks ago. Since then, the stock has declined from a high of 4.37 to a low las week of 3.39. DRYS is having trouble getting over a number of moving averages to include all on my chart except the MA200 sitting at 3.01. The FullSto is in very oversold territory but the the MACDs are just entering theirs. If the stock breaks below the 3.39 short term bottom, then I would be targeting the 3.15 area as a possible double bottom. GLTA

 (0)
(0) (0)
(0)