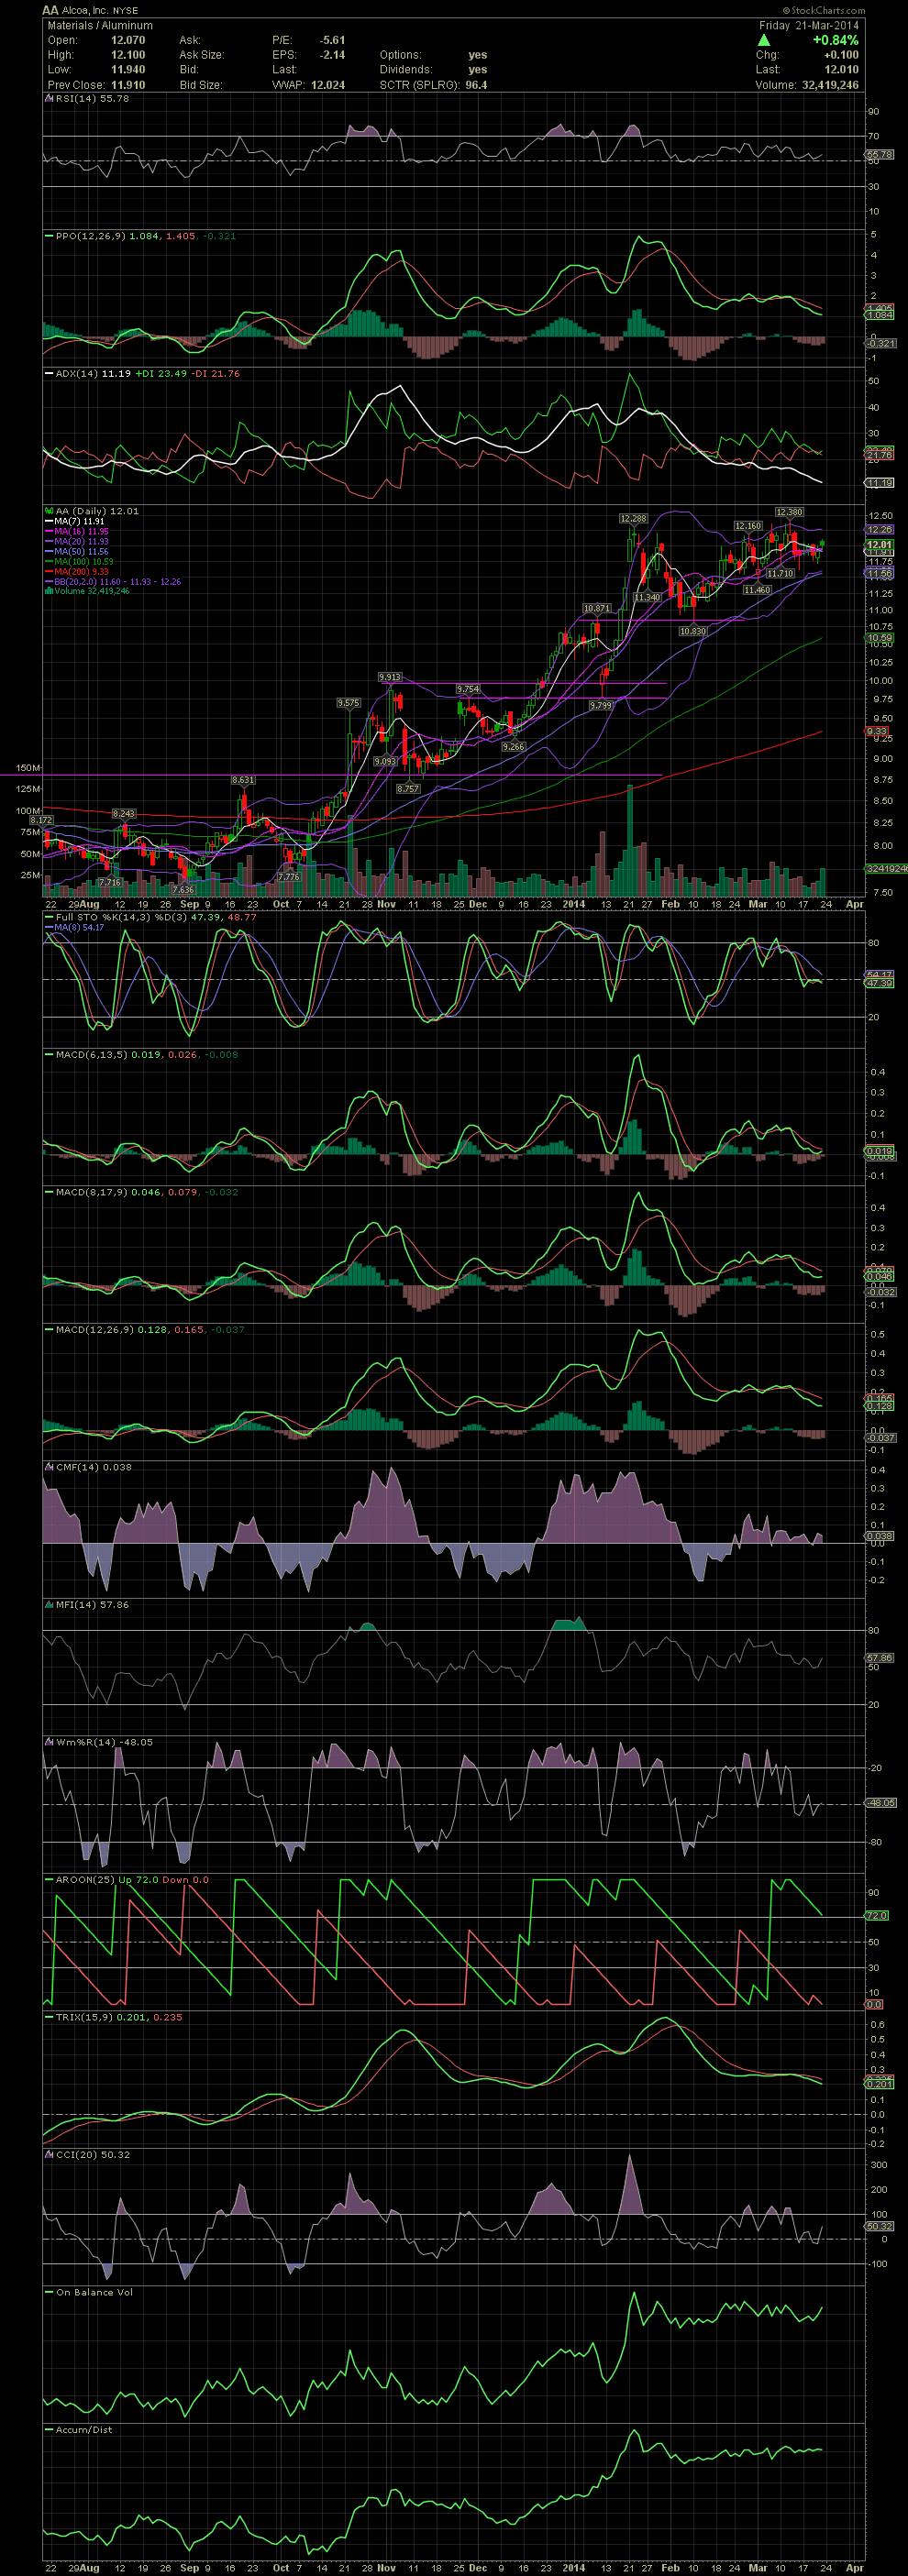
AA Daily Chart ~ Continuing to Trend Between 11.70
Post# of 2561
I heard from those that were still in AA when I last put up a chart on AA. They have all sold since for gains of 10.2% to almost 14%. Not bad for your 5th and 6th swing in AA. The last few weeks haven't shown enough volatility for me to step back into AA. Should the stock break under the recent basing at 11.70s, then we could maybe see a decline below 11.46 and down to the 10.80s. At that time, I might look at re-entering. But for now, although I really like the fundamental turnaround that the company is executing, there are just too many other stocks offering better swing trade possibilities. GLTA

 (0)
(0) (0)
(0)