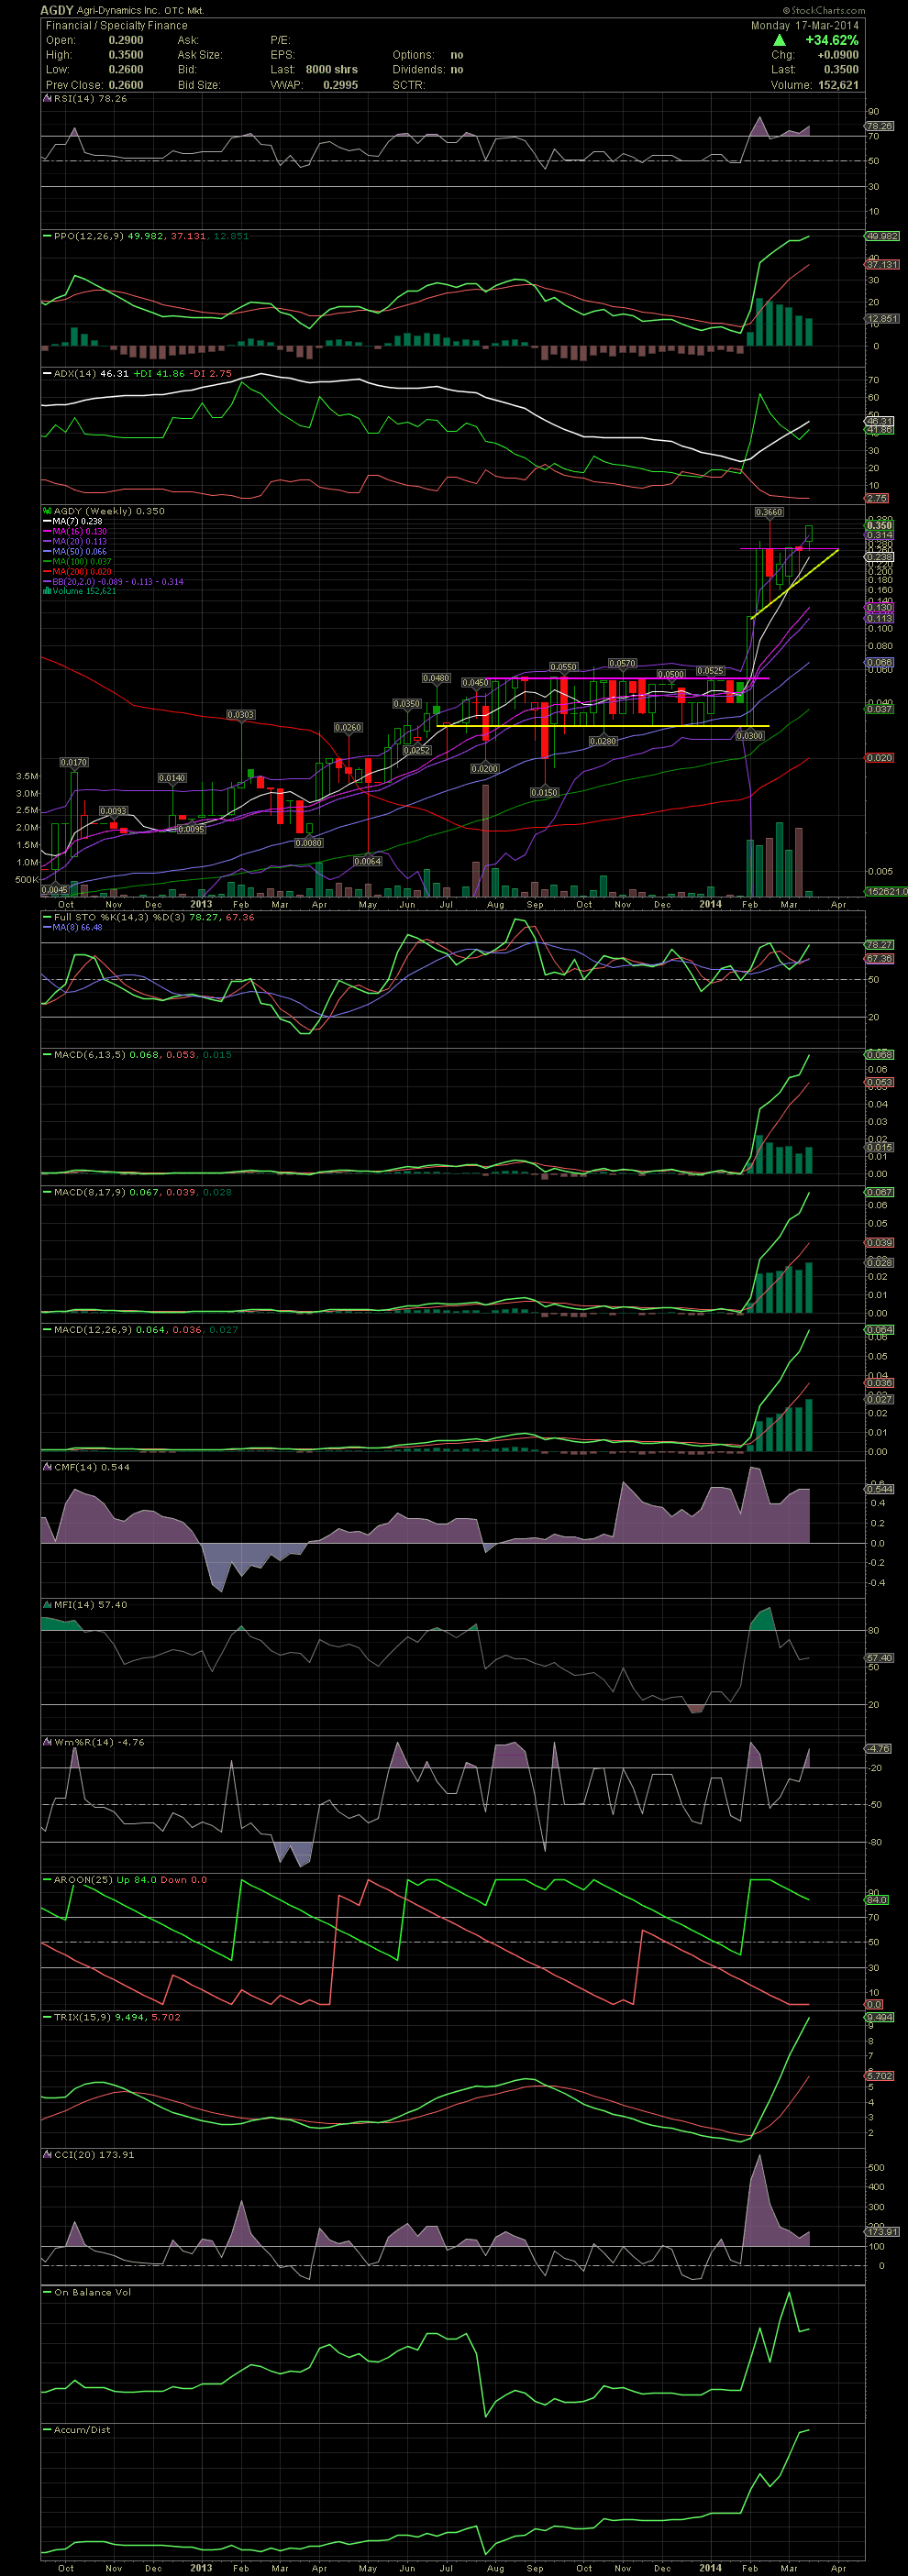
AGDY Weekly Chart ~ Beginning the Sixth Week of Co
Post# of 2561
Sometimes the longer term view tells the tale. That's the case with the Weekly Chart for AGDY. With an eight month trading channel from June to January, the sharp move upwards was easy to happen as the entire float, then some, was absorbed during that eigth month channeling. Congrats to all that were able to add near the lows during the current consolidation with the pullback from the high of .366. With any luck, that high should be taken out tomorrow. Get ready for $$. GLTA

 (0)
(0) (0)
(0)