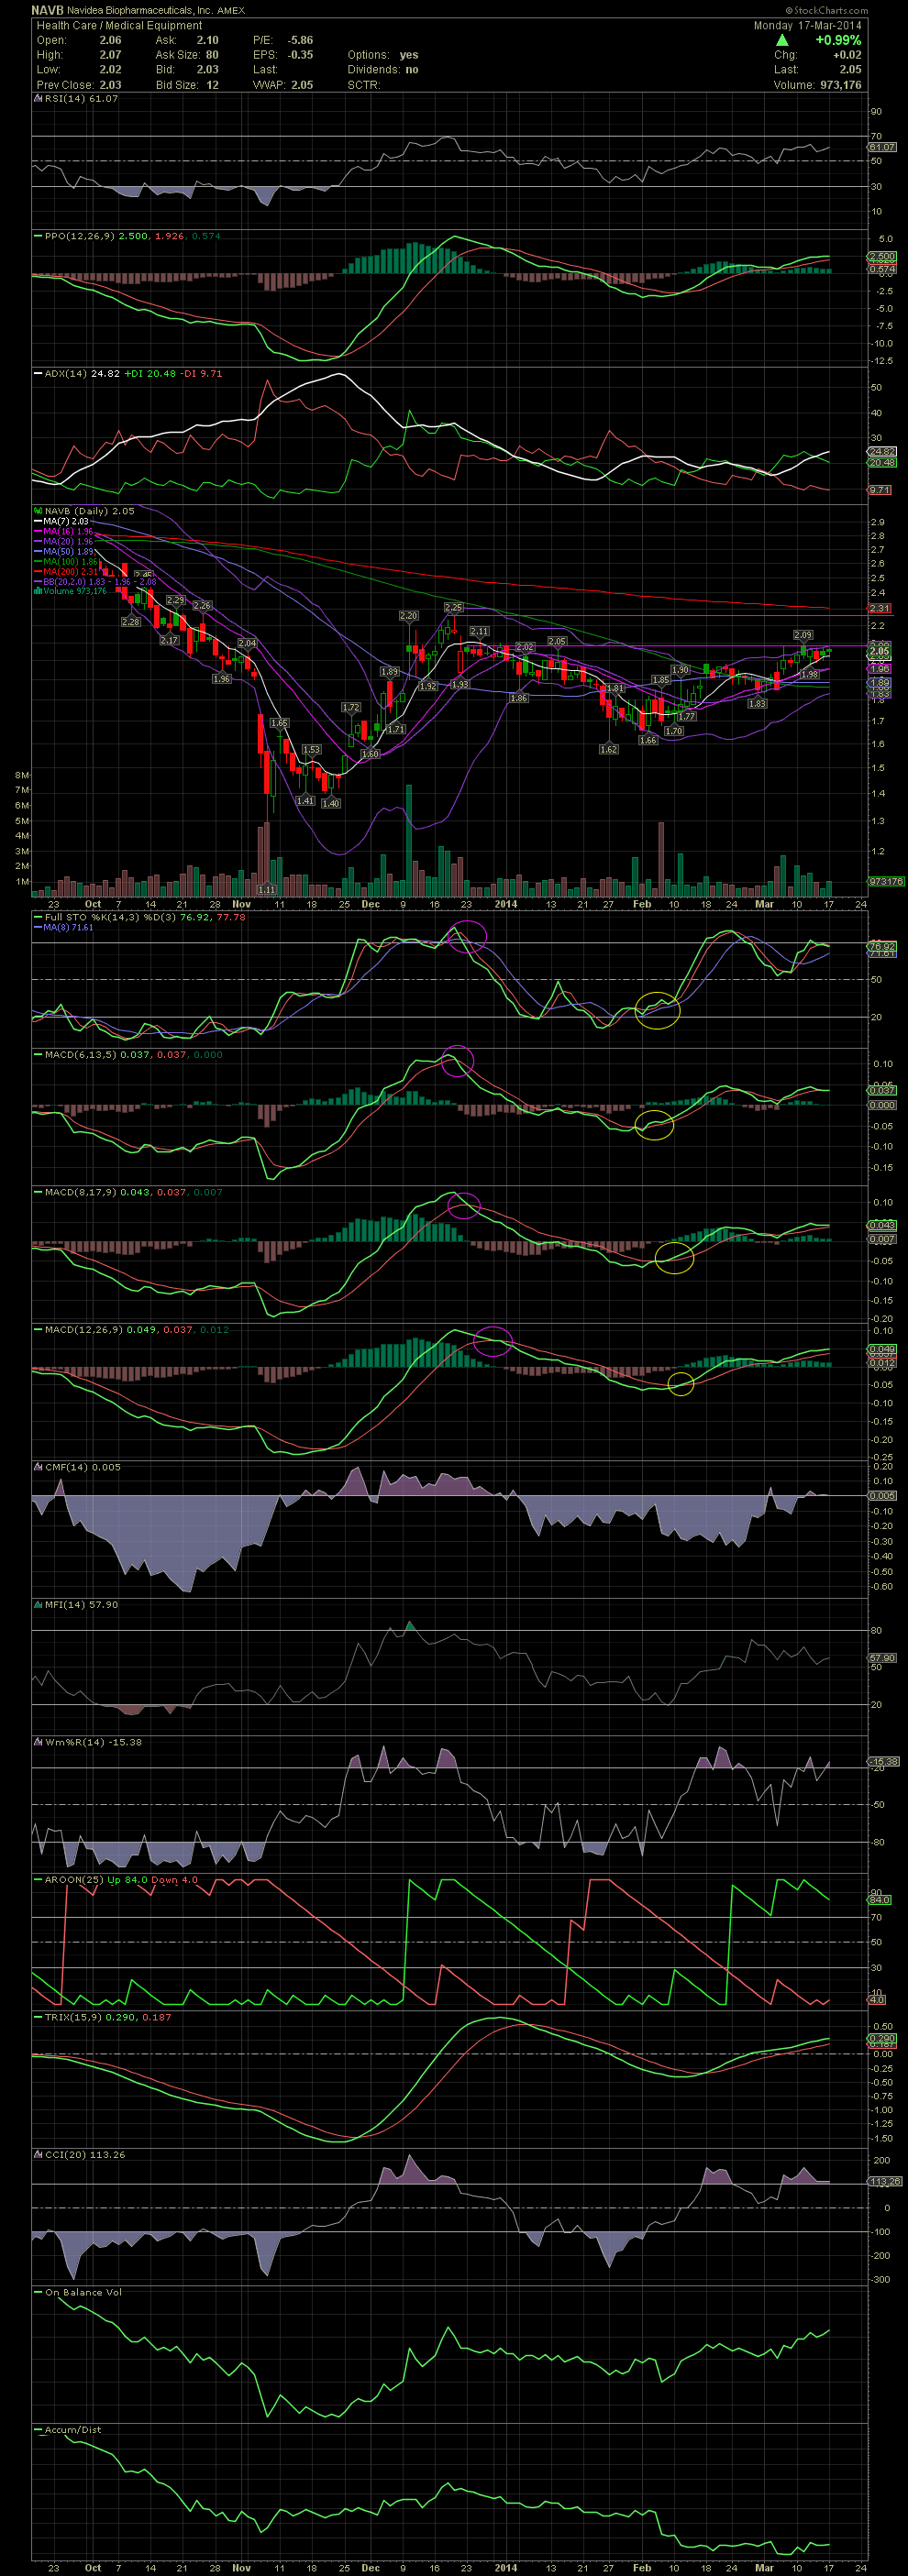
NAVB Daily Chart ~ Getting Very Close to Breaking
Post# of 2561
Link back to my Feb 9 chart/post when NAVB was at $1.74. At that time I thought I would be selling once the stock rebounded to the $2.00 area. Instead, I added 2,000 more shares today at an average of 2.03. I'm now looking for a break above the horizontal resistance line at approx 2.08. Should that occur, then a test of the December high of 2.25 could be seen. GLTA

 (0)
(0) (0)
(0)