PLUG Daily Chart ~ Back Down To Earth I know a f
Post# of 2561
Posted On: 03/11/2014 5:39:52 PM

PLUG Daily Chart ~ Back Down To Earth
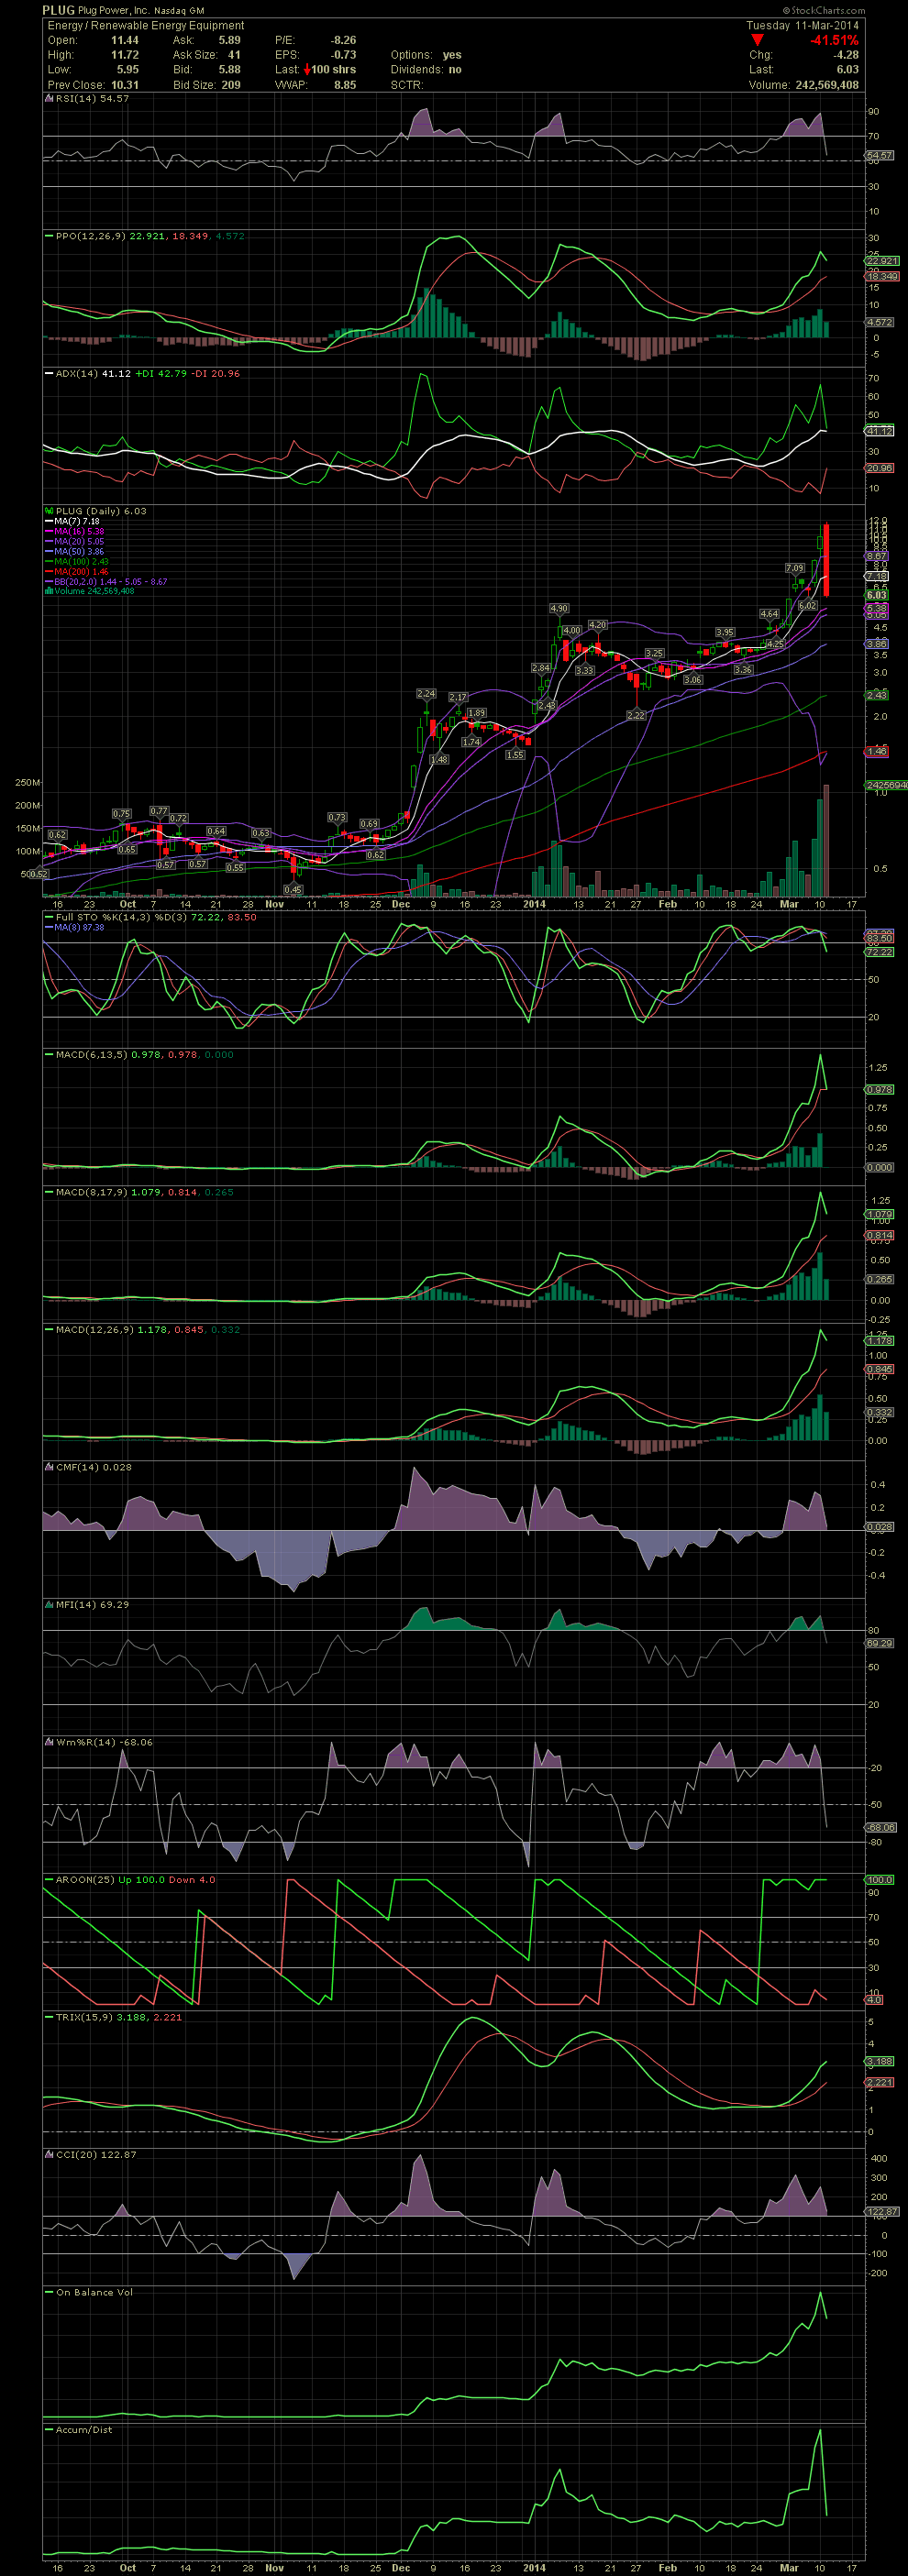
I know a few who traded PLUG over the last few weeks. Some were a bit upset because they sold on Friday and yesterday when the chart and indicators got a little bit overextended and overbought. As I've mentioned in the past, when a stock gets into the stratosphere with every pumping clown screaming and chasing a stock, it's never a bad idea to take some or all off the table. The FullSto actually began curling last week. Yesterday saw the MACDs begin turning down. The RSI was in the so called 'power zone', which to me represents 'the overbought zone' and time for profits. And then there's the issue of the entire candle being outside the upper bollie after a tremendous move up. Exhaustion gap, blowoff, whatever one wants to call it. As always, no one will ever know how far a stock might fall when it begins to return inside the bollies. But when it turns, it can get very ugly. Today's intraday drop from a high of 11.72 to a low of 5.95 was huge. But if one stayed vigilant and watched the indicators over the last few days, especially with yesterday's move outside the bollies, one would have sold for huge gains. I was also reading numerous messages in a few rooms how people were jumping in (blindly IMO) trying to catch the falling knife from as high at 10.00. My guess is that most of those peole didn't have a chart in front of them, watching the indicators falling out of beg. Use the technicals to your advantage. They work! GLTA
I know a few who traded PLUG over the last few weeks. Some were a bit upset because they sold on Friday and yesterday when the chart and indicators got a little bit overextended and overbought. As I've mentioned in the past, when a stock gets into the stratosphere with every pumping clown screaming and chasing a stock, it's never a bad idea to take some or all off the table. The FullSto actually began curling last week. Yesterday saw the MACDs begin turning down. The RSI was in the so called 'power zone', which to me represents 'the overbought zone' and time for profits. And then there's the issue of the entire candle being outside the upper bollie after a tremendous move up. Exhaustion gap, blowoff, whatever one wants to call it. As always, no one will ever know how far a stock might fall when it begins to return inside the bollies. But when it turns, it can get very ugly. Today's intraday drop from a high of 11.72 to a low of 5.95 was huge. But if one stayed vigilant and watched the indicators over the last few days, especially with yesterday's move outside the bollies, one would have sold for huge gains. I was also reading numerous messages in a few rooms how people were jumping in (blindly IMO) trying to catch the falling knife from as high at 10.00. My guess is that most of those peole didn't have a chart in front of them, watching the indicators falling out of beg. Use the technicals to your advantage. They work! GLTA
 (0)
(0) (0)
(0)