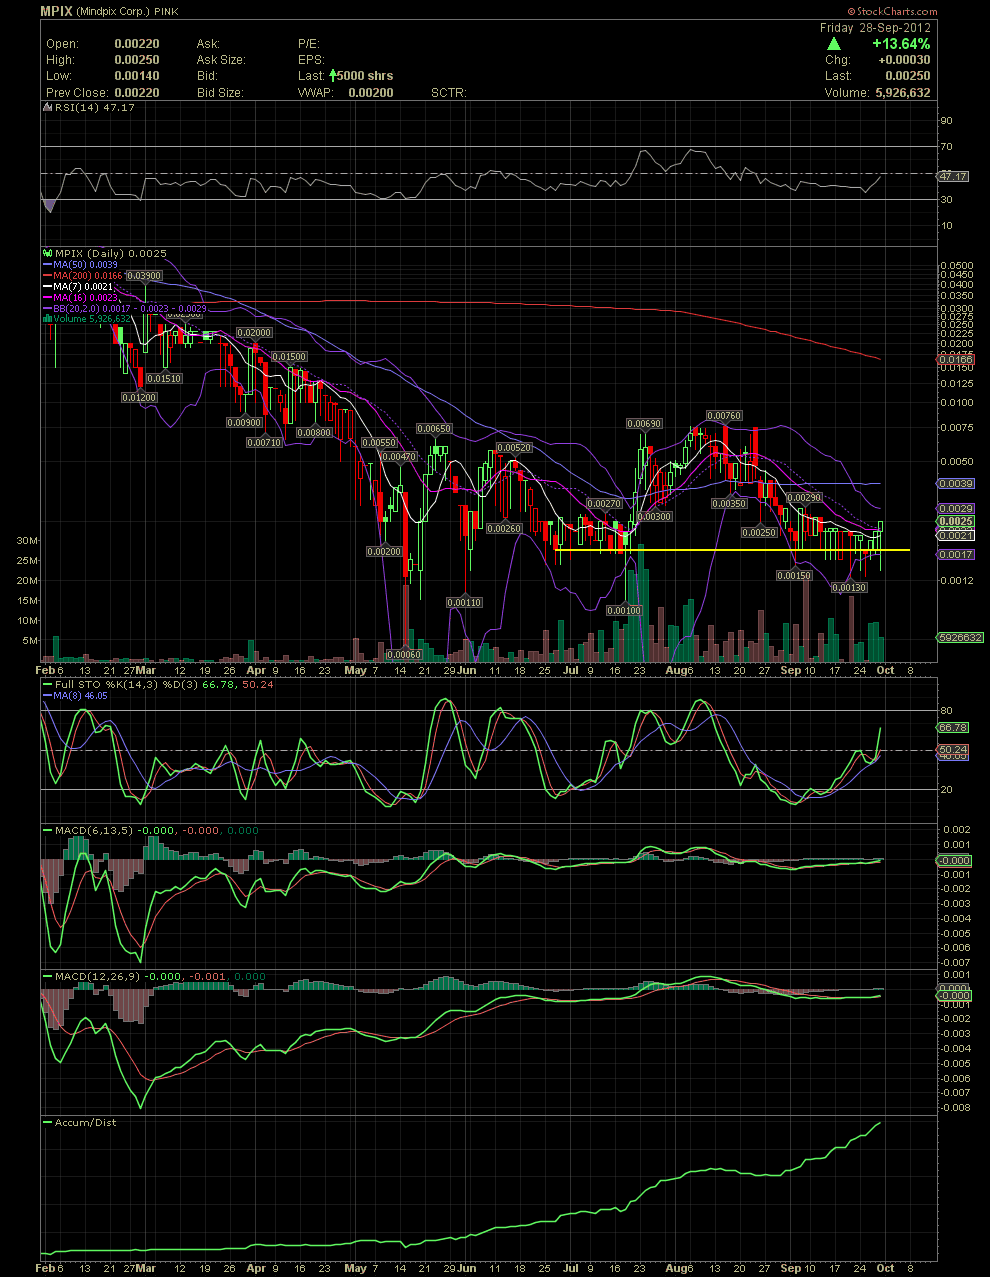
MPIX Chart - Highest close in almost three weeks.
Post# of 5570

MPIX Chart - Highest close in almost three weeks. Keep big bids in at the bid or lower. Allow the shorts, weak hands, and the impatient to sell to you and move on while still hitting the ask from time to time. Not only does this help one to accumulate a very nice position, it keeps the interest of those watching and waiting. While many wonder where all the bidwhackers are coming from, I say 'Thank you very much Sir, may I have another please!'
To the chart with my basics. I'll leave the more detailed information to Coolnapz. As I mentioned previously, most all of the last few weeks, we've seen intraday sellers into the mid .001s only to be followed by end of the day buying. The pattern of the shorts and seller has been to wait until a large bid appeared and then almost immediately hit it. The multi million sell near the end of every day for weeks now has had little or no effect on the closing price of the stock. With the exception of one day this week and one in July, the stock has closed at .002 or higher since May. That should tell everyone where the support of MPIX lies, right at .002. As Cool has been saying, expect the bottom to be in near the .0015. Once again, more than obvious when one studies the trading patterns and the closing prices. Six of the last seven trading days were green. The only red close was one of the day lowest volume days this year. HELLO?!
You all have a great weekend!

 (0)
(0) (0)
(0)