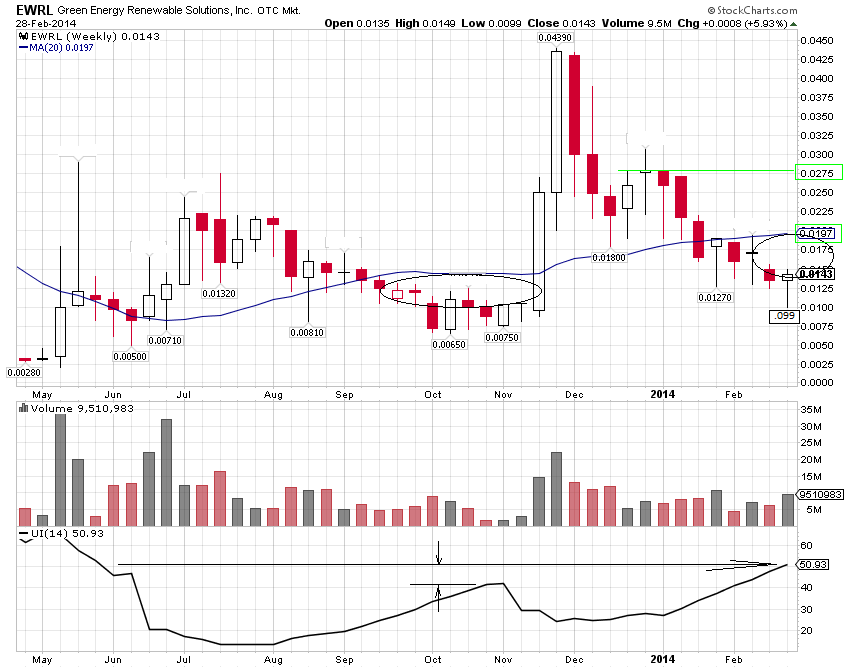
Here's a simple weekly candle view noting deviations with regards to SMA/share price....and the Ulcer Index to previous Ulcer. Note also short term targets of resistance and support....this will be where you can adjust to others actions and know where to look for add on points after a rush/reset.


 (0)
(0) (0)
(0)


 (0)
(0) (0)
(0)