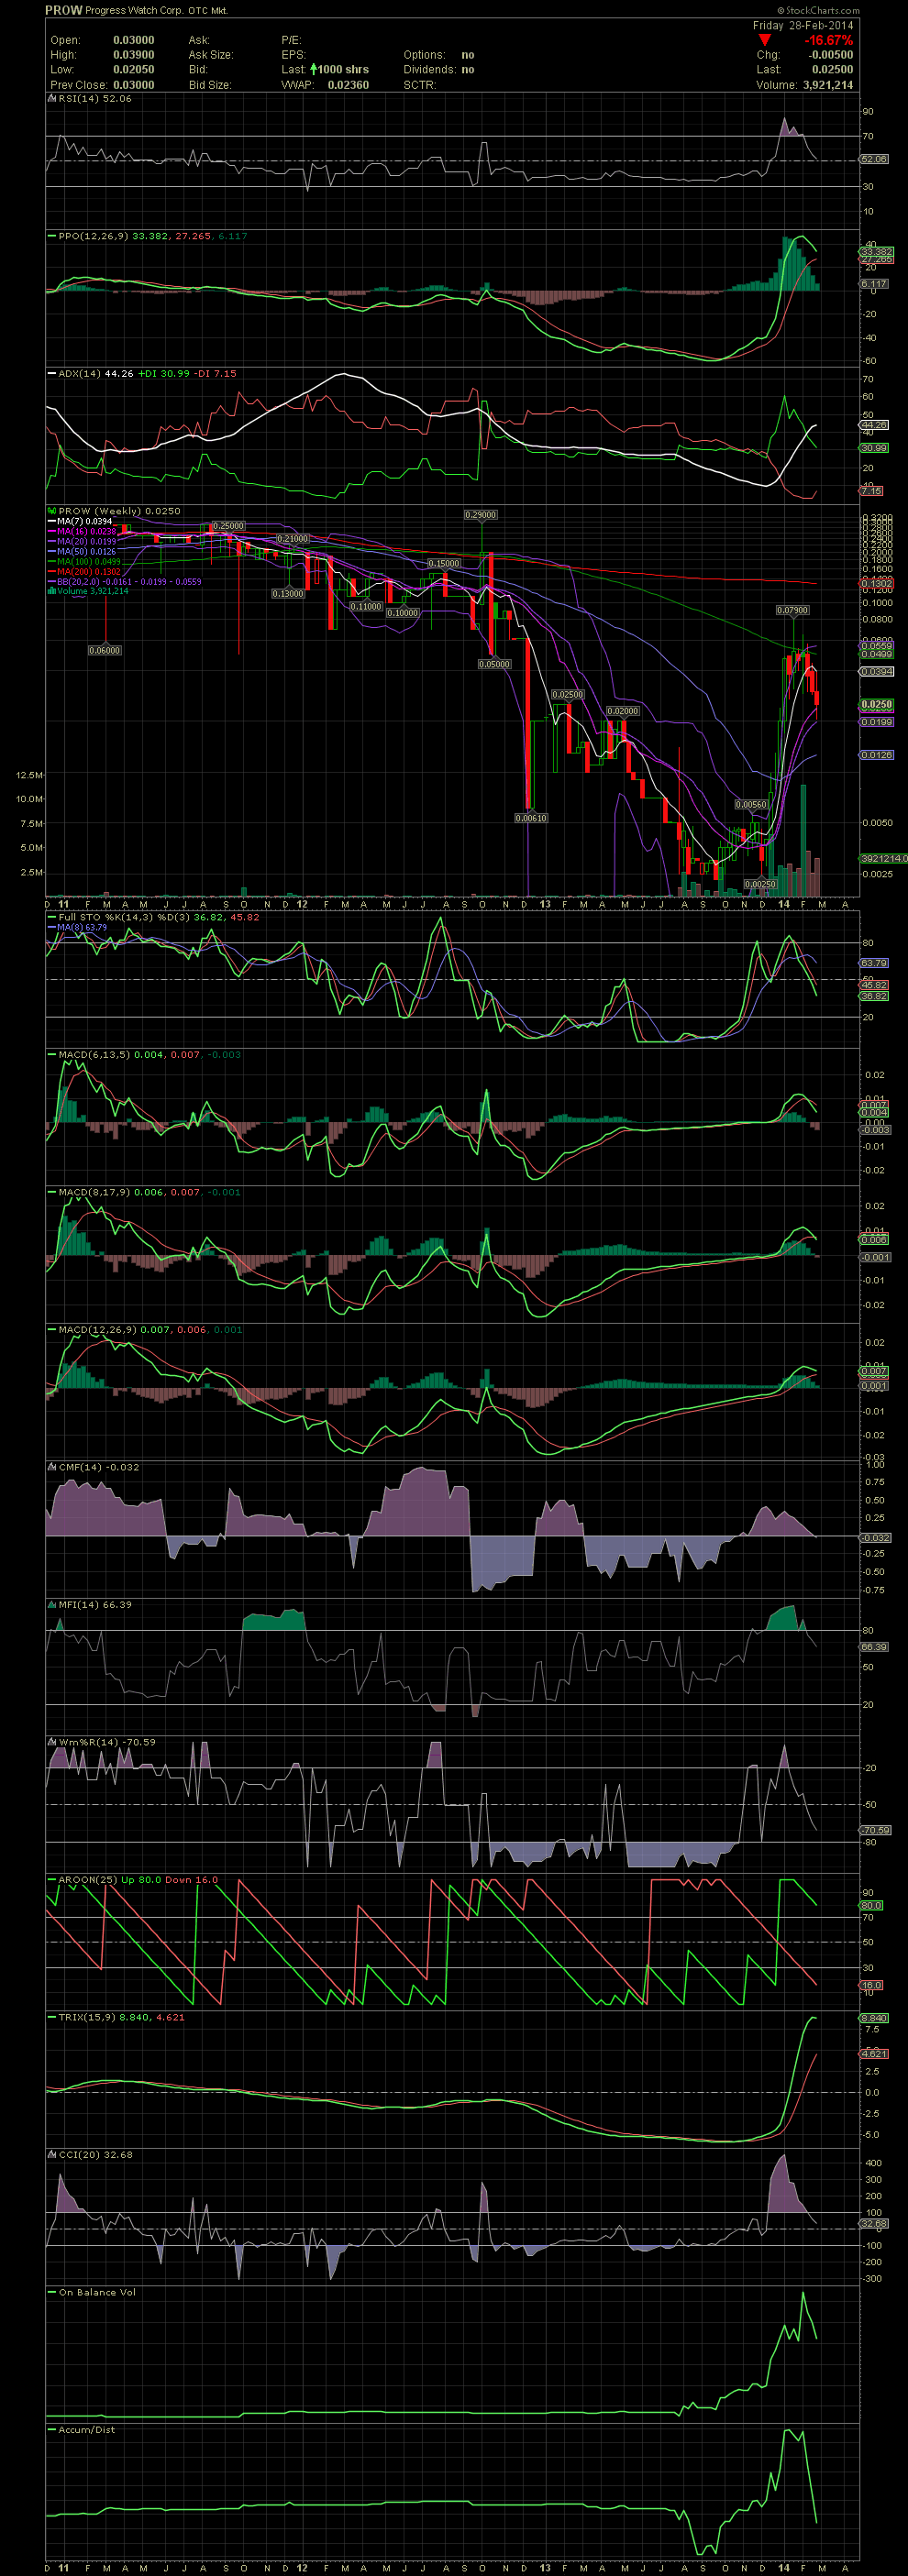
PROW Weekly Chart ~ A Quick Look for a Good Reason
Post# of 2561

When a stock is moving, as PROW did in Dec and Jan, it's always a good thing to look at a weekly chart to see what resistance there might be there. The MA100 proved to be more resistance than I thought at the time. The MA20 is sitting at .0199, so no surprise to me that the stock is beginning to hold at .0205 over the last three days. GLTA

 (0)
(0) (0)
(0)