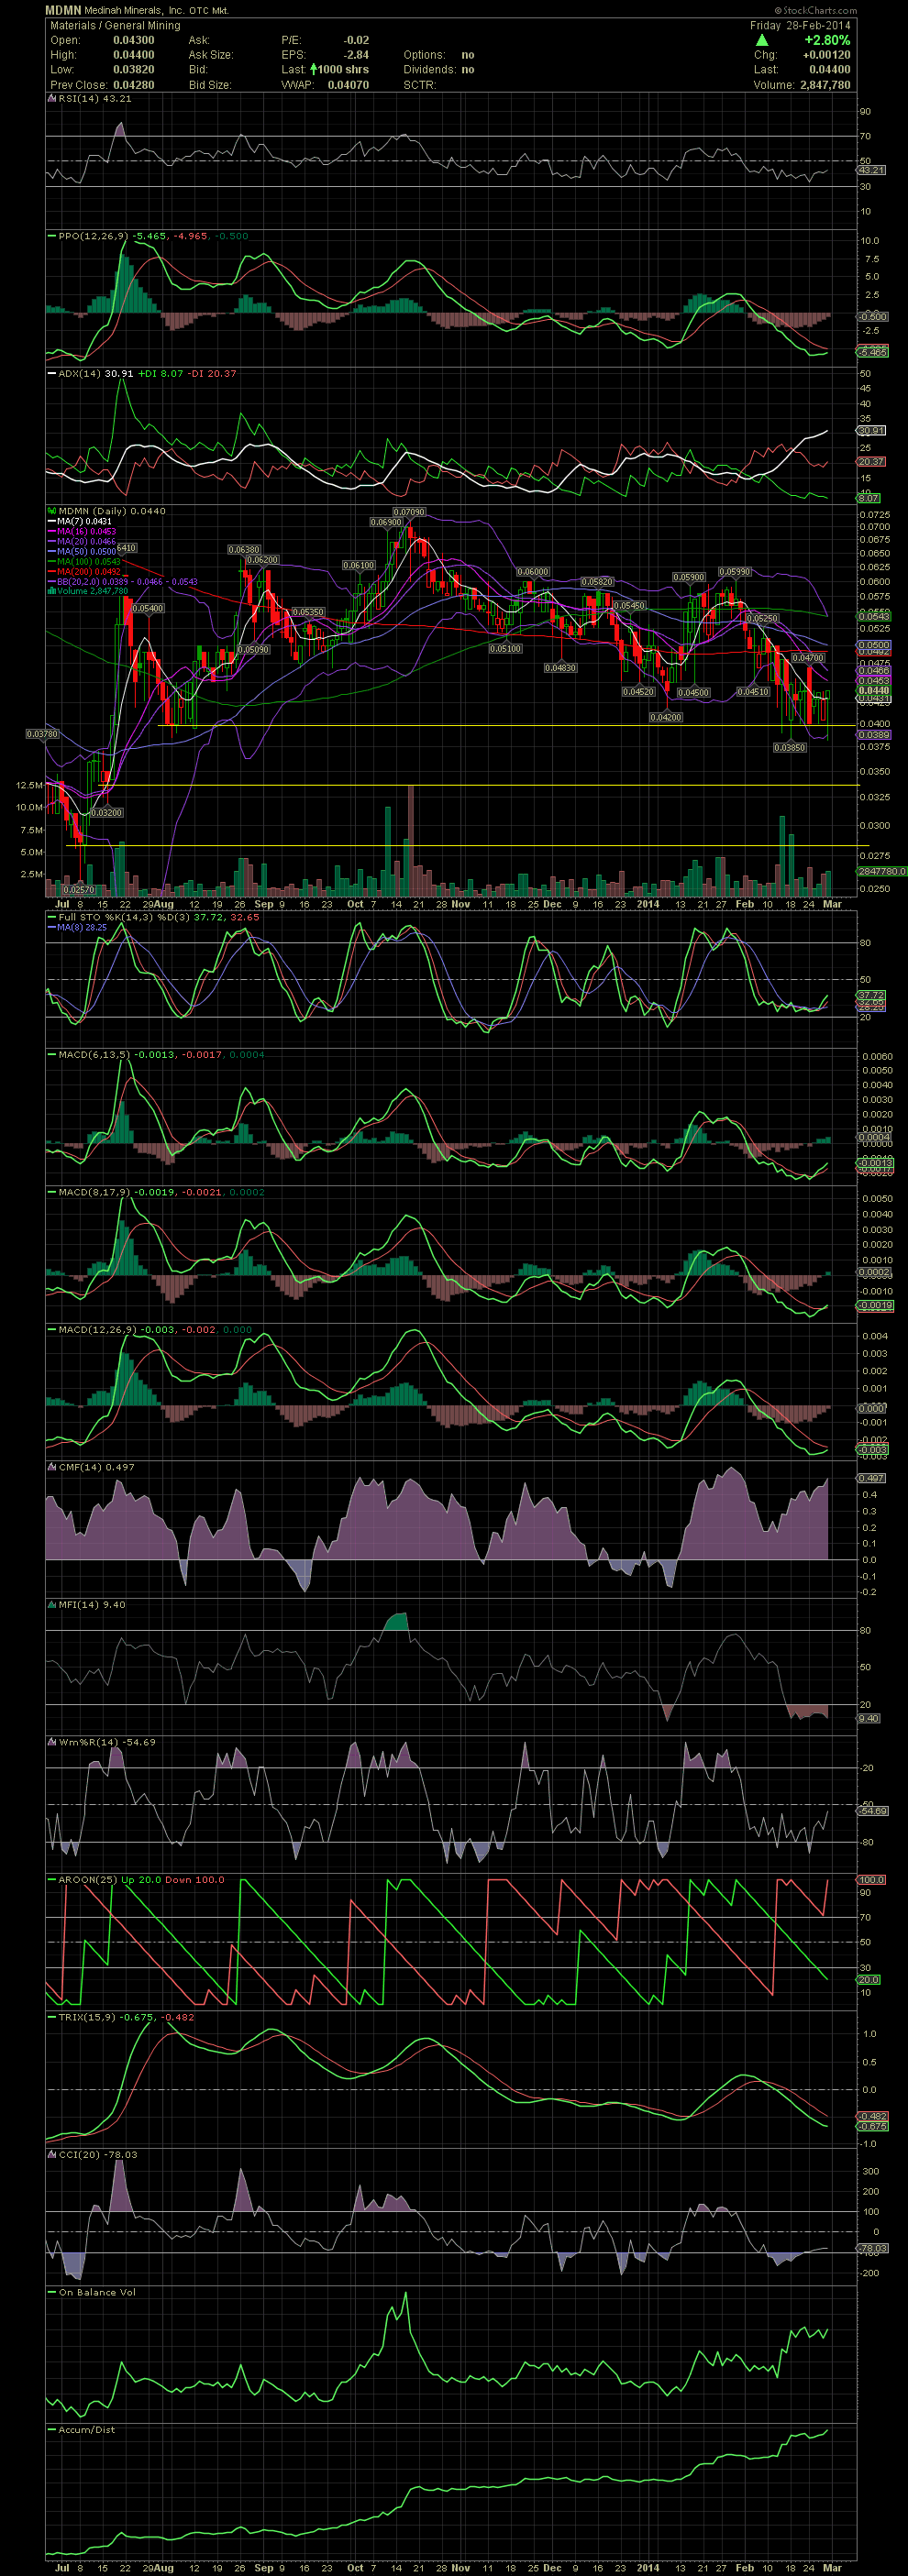
MDMN Daily Chart ~ Basing Near the .0385/.004 Leve
Post# of 2561

As I shared previously, when MDMN failed to hold the MA200, I thought the stock would then retest the Jan 2014 low of .042 and possible decline to the low of .0385 set in Aug 2013. The stock has gradually sold of to the .0385/.004 as expected. I am currently not in MDMN but am considering another position for a swing trade back to the high .059s/.06s. If the .038 level doesn't hold, I would be looking for .0325/.033. If that doesn't hold, you see the lowest horizontal support line on the chart in the .02s. That said, the FullSto and MACDs are crossing over to the positive, so the risk/reward is probably there for a calculated entry. I almost entered at buy at .039 on Friday after the stock hit .0382 and began to move back up. There are the never ending hints at a deal finally becoming a reality for MDMN shareholders, but oh how I wished I had swing traded the stock during the many years where I held instead. GLTA

 (0)
(0) (0)
(0)