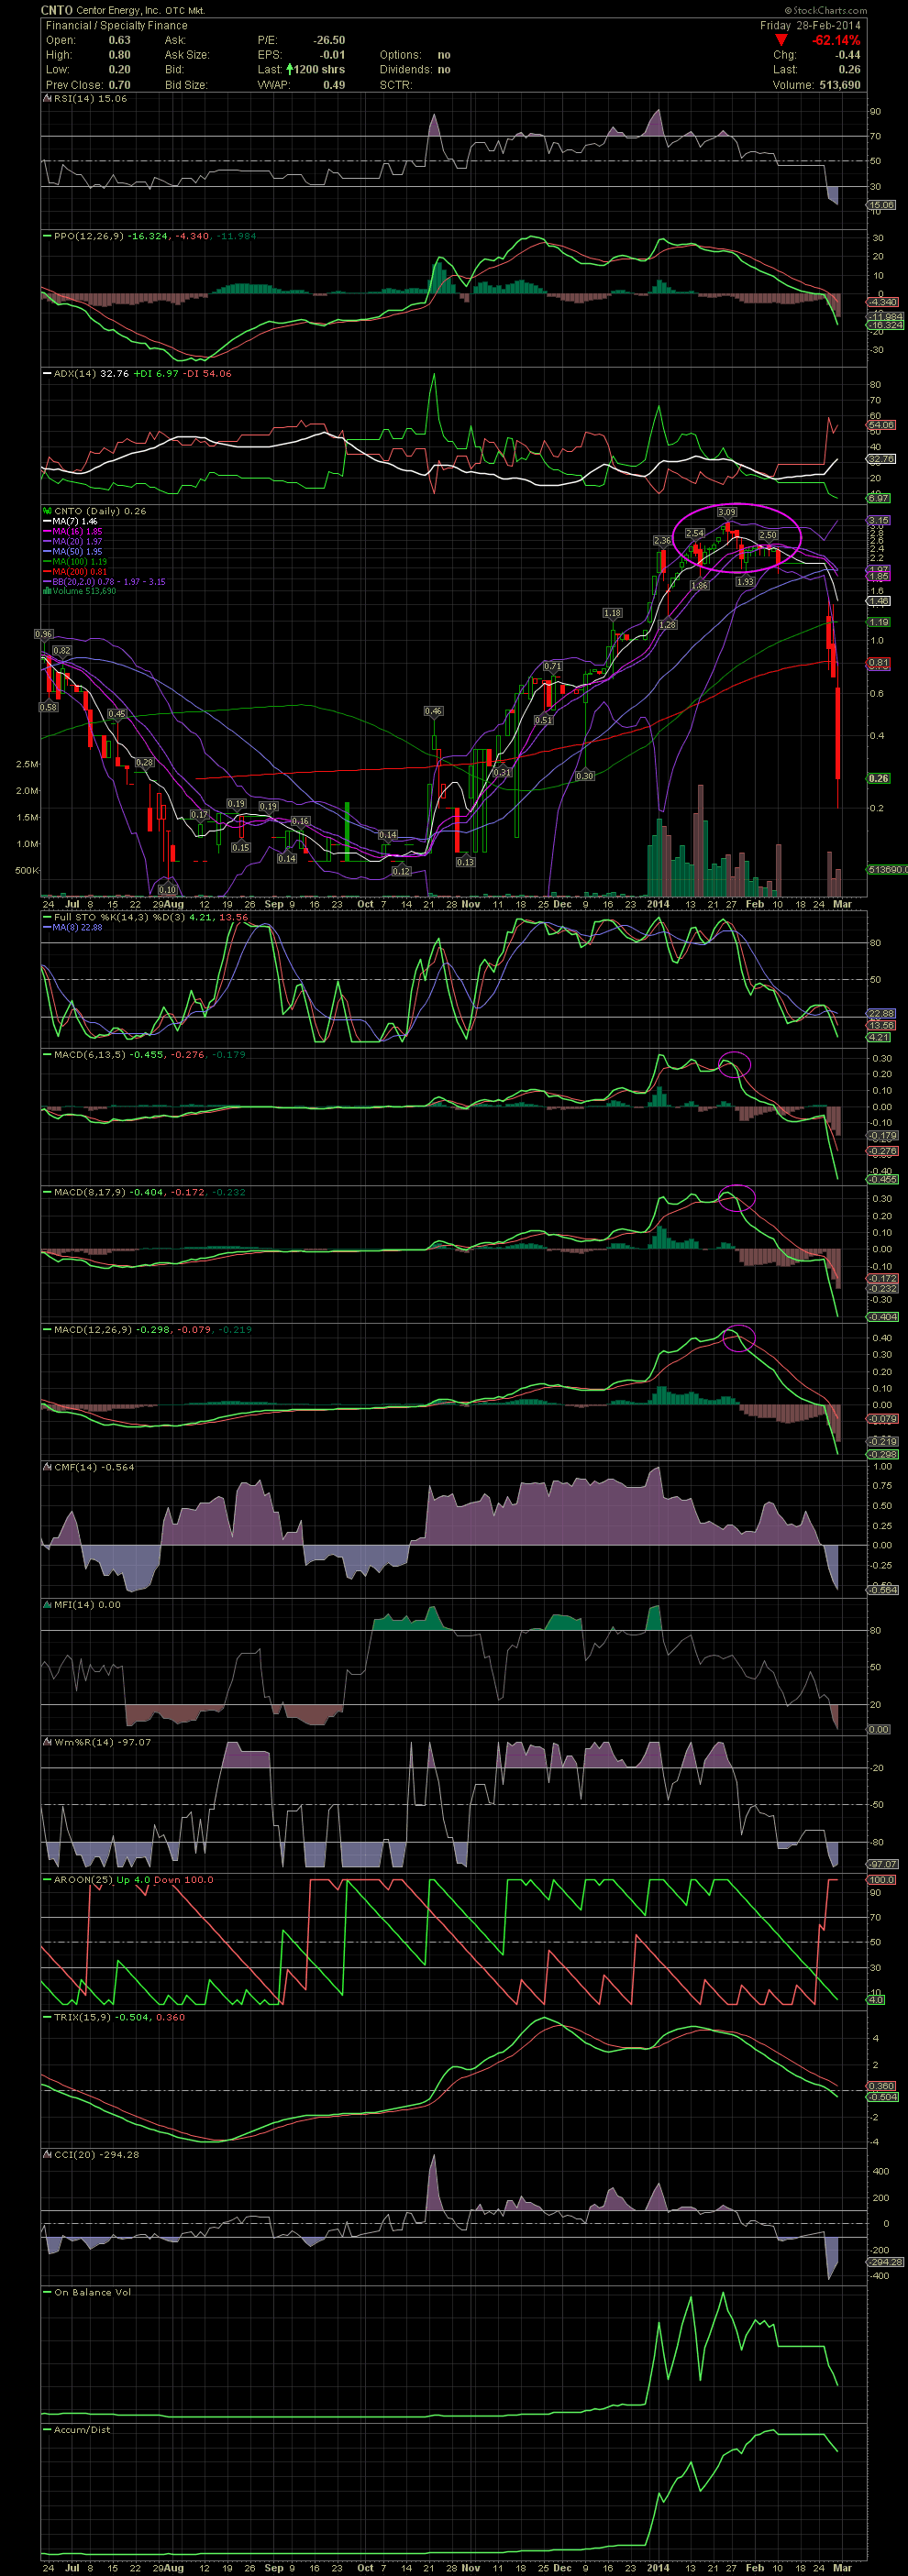
CNTO Daily Chart ~ A Disaster Evolving Before Our
Post# of 2561

I had three friends in CNTO when the stock was still trading in the 2.70 to 3.00 range. They all did well because they followed the chart speak. When the FullSto and MACDs began crossing over to the negative, I suggested they might want to take a few or all off as one never knows how far a stock might pullback. What's outside the bollie ALWAYS comes back within the bollies. A stock can either simply stall while the bollie continues higher to catch up, it could trade sideways with a slightly negative bias, or a stock can collapse as is the case with CNTO. Those that didn't pay attention to the indicators in mid to late January are paying a horrendous price for that error. I fully expect new lows as the huge volume spike seen in January hasn't even hit the sell side yet. I don't know anyone in CNTO, but can certainly relate to individuals that are getting slaughtered. Been there, done that. Listen to the indicators and what the charts are telling you. Simple as that. GLTA

 (0)
(0) (0)
(0)