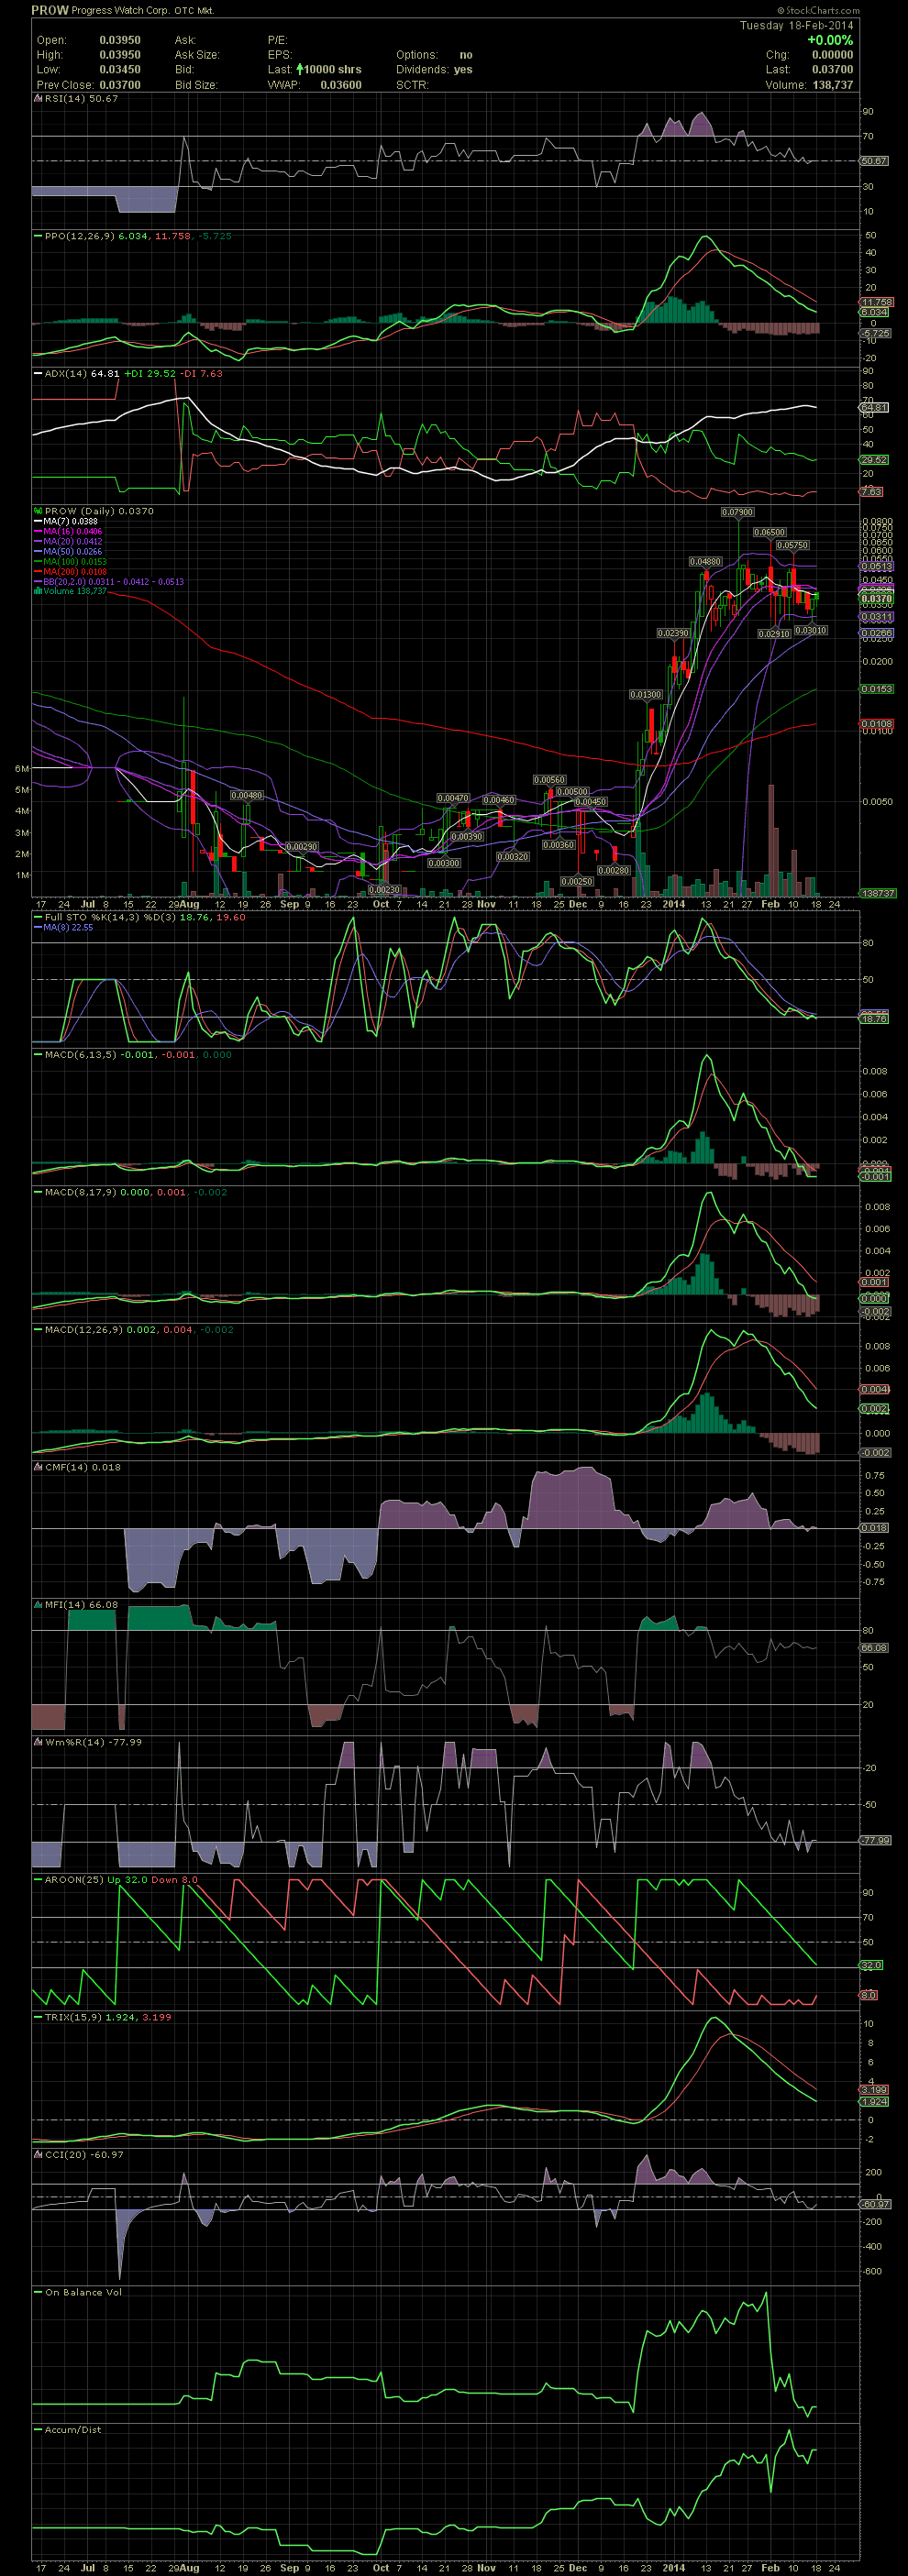
PROW Daily Chart ~ Consolidation and Accumulation
Post# of 2561
As can be seen on the chart, the trading in PROW has been in a sideways trending pattern primarily in the .03s. The daily swings are becoming tighter as the volume is receding for the initial large selloff days in early February. The indicators are continuing to reset from very overbought levels towards slightly oversold territory. Without knowing when any company updates or news releases might come, my guess is that the stock could continue its sideways movement allowing the indicators to reset in another 1-2 weeks. GLTA

 (0)
(0) (0)
(0)