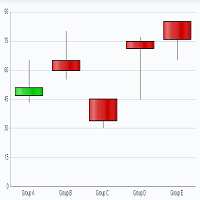
CANN Stock Chart Sun, Feb 16th, 2014
Post# of 338555

Period Moving Average Price Change Percent Change Average Volume
5 Day 13.6450 +5.0050 +40.63% 125,660
20 Day 14.6725 -5.7050 -24.77% 161,735
50 Day 8.7846 +14.9250 +621.88% 118,972
100 Day 6.2709 +12.1750 +236.41% 60,270
200 Day
Year to Date 12.8313 +14.0750 +433.08% 189,642
Period Raw Stochastic Stochastic %K Stochastic %D Average True Range
9 Day 99.92% 67.36% 47.29% 1.9544
14 Day 99.92% 52.08% 30.26% 1.9374
20 Day 52.92% 28.39% 24.62% 1.8174
50 Day 72.04% 58.87% 53.34% 1.2568
100 Day 72.43% 59.00% 53.38% 0.9061
Period Relative Strength Percent R Historic Volatility MACD Oscillator
9 Day 68.74% 0.08% 141.18% +1.1122
14 Day 64.72% 0.08% 136.36% +0.8275
20 Day 63.52% 47.08% 164.23% -0.2808
50 Day 62.56% 27.96% 241.21% +5.6071
100 Day 62.05% 27.57% 202.71% +8.1208
 (0)
(0) (0)
(0)