TDEY Daily Chart ~ A Three Month Decline and a Hug
Post# of 2561
Posted On: 02/09/2014 7:45:12 PM

TDEY Daily Chart ~ A Three Month Decline and a Huge Lesson
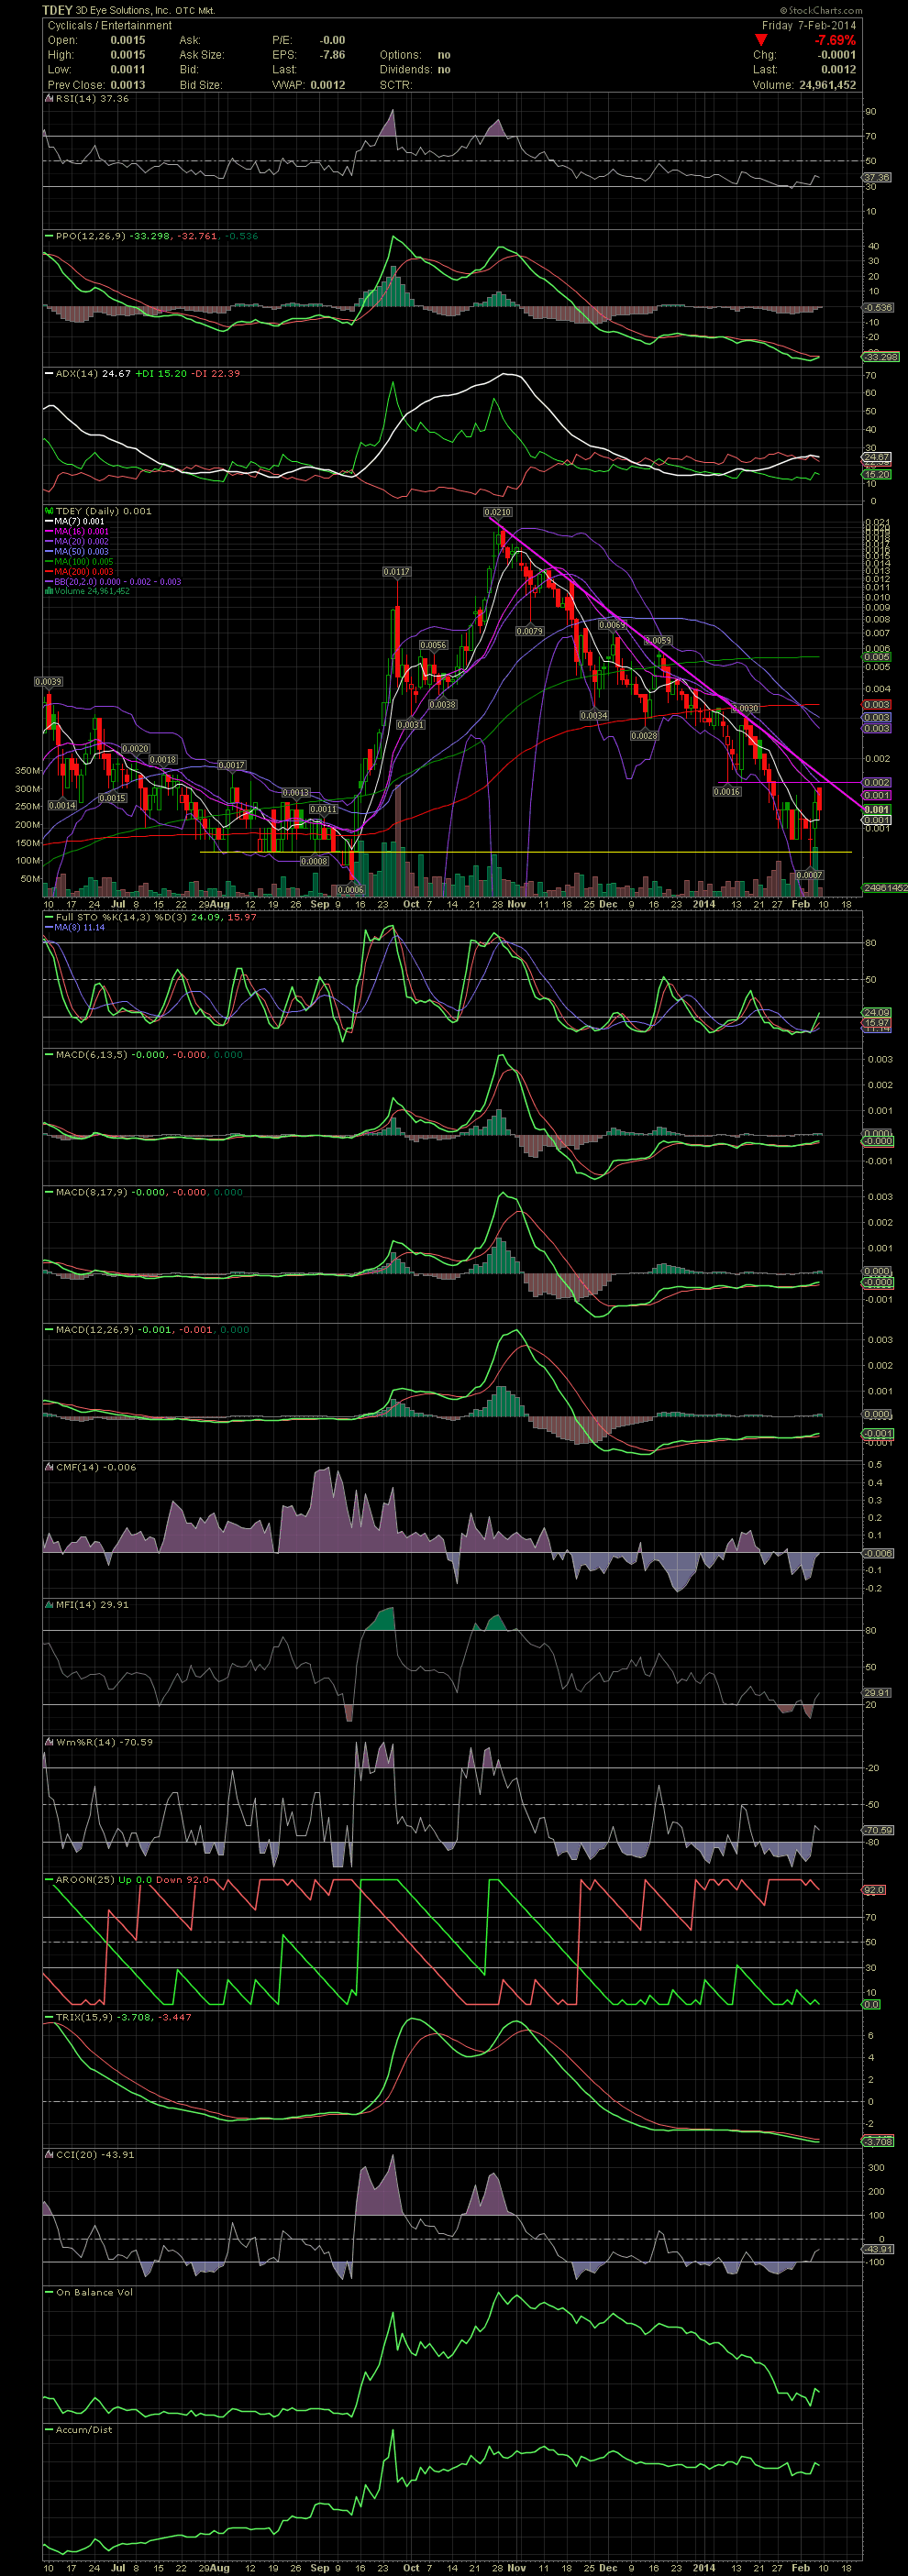
After a huge run from Oct to as high of .021 from a low of .0006, TDEY has declined to a low of .0007, or almost to where it began. Simply stated, listen to what the chart is telling you, or in the case of TDEY, listen to what the chart was screaming....... sell, sell, sell. This stock was my worst mistake due to my absolute failure to follow through and take some, or all, off the table when the indicators gave sell signals. That said, looking at the indicators now, a bottom could finally be in place. Note the levels of the FullSto and MACDs which are actually beginning to crossover to the positive. With new management in place, it's anyone's guess as to when this company might turn out some material news. Like I said before, the kool aid tasted great during the run, but the losses for being foolish in not getting out when the chart was screaming at me to do so will be a great reminder and lesson of what can go wrong when not using the charts. I can assure you, that mistake of not following the money flow will NOT happen to me again. I'll continue to follow TDEY for quite some time because I have many friends that are still in the stock. Most are at losses while a few have actually averaged down to the .0007s and are green at .0012. Please use this chart below as a constant reminder of what can happen when you don't follow the indicators. GLTA
After a huge run from Oct to as high of .021 from a low of .0006, TDEY has declined to a low of .0007, or almost to where it began. Simply stated, listen to what the chart is telling you, or in the case of TDEY, listen to what the chart was screaming....... sell, sell, sell. This stock was my worst mistake due to my absolute failure to follow through and take some, or all, off the table when the indicators gave sell signals. That said, looking at the indicators now, a bottom could finally be in place. Note the levels of the FullSto and MACDs which are actually beginning to crossover to the positive. With new management in place, it's anyone's guess as to when this company might turn out some material news. Like I said before, the kool aid tasted great during the run, but the losses for being foolish in not getting out when the chart was screaming at me to do so will be a great reminder and lesson of what can go wrong when not using the charts. I can assure you, that mistake of not following the money flow will NOT happen to me again. I'll continue to follow TDEY for quite some time because I have many friends that are still in the stock. Most are at losses while a few have actually averaged down to the .0007s and are green at .0012. Please use this chart below as a constant reminder of what can happen when you don't follow the indicators. GLTA
 (0)
(0) (0)
(0)