XRX Daily Chart ~ A Bottom Could be Upon Us XRX
Post# of 2561
Posted On: 02/09/2014 5:26:22 PM

XRX Daily Chart ~ A Bottom Could be Upon Us
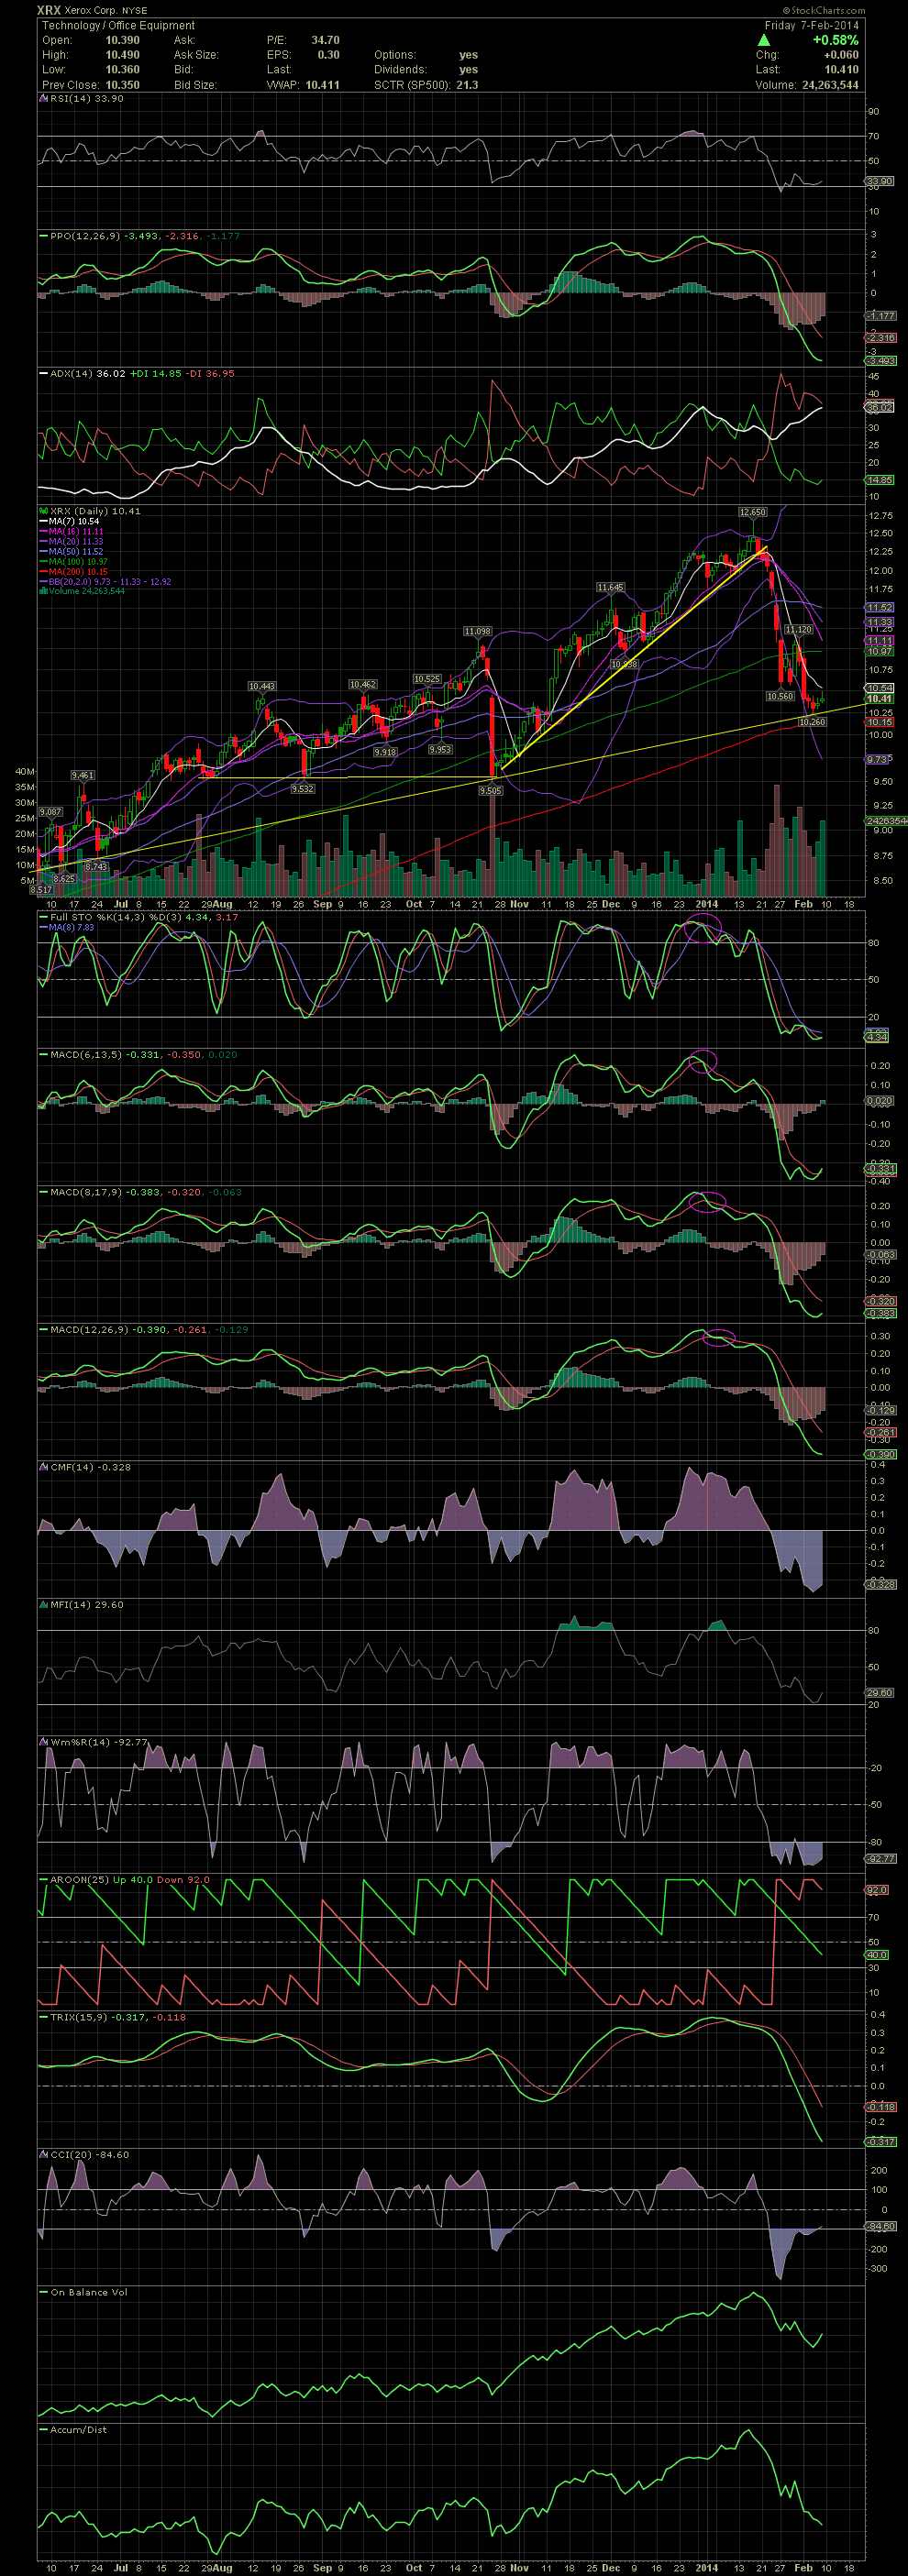
XRX has been a Big Board, Boring But Banking swing trade for many of us. Our recent exits in the low 12.00s (link back) proved to be even better than hoped for. The stock has fallen thru all moving averages, the 20, 50, and 100, and has declined to its rising support line in place since pre July. Along that way that helped us with a few swing trades was the triple bottom set from late July into October (solid yellow) after getting outside the upper bollie. If you recall, the fund manager sheeple offered up that entry for us after they stampeded out of the stock during that two day collapse. Once that support line held, the stock began a new leg up with a new rising support line from established from late October into mid January. The latest correction has witnessed the stock falling to the longer trending support line at the 10.25 level. Will this prove to be the bottom? Don't know. But in viewing the extremely oversold levels of the FullSto and MACDs, I would take a calculated guess and say yes. XRX isn't quite yet at a buy signal crossover, but having funds on the sidelines after sidestepping the 20% drop from the 12.00s, makes it easier to make a decision to re-enter when the chart is saying the stock is oversold, rather than overbought. GLTA
XRX has been a Big Board, Boring But Banking swing trade for many of us. Our recent exits in the low 12.00s (link back) proved to be even better than hoped for. The stock has fallen thru all moving averages, the 20, 50, and 100, and has declined to its rising support line in place since pre July. Along that way that helped us with a few swing trades was the triple bottom set from late July into October (solid yellow) after getting outside the upper bollie. If you recall, the fund manager sheeple offered up that entry for us after they stampeded out of the stock during that two day collapse. Once that support line held, the stock began a new leg up with a new rising support line from established from late October into mid January. The latest correction has witnessed the stock falling to the longer trending support line at the 10.25 level. Will this prove to be the bottom? Don't know. But in viewing the extremely oversold levels of the FullSto and MACDs, I would take a calculated guess and say yes. XRX isn't quite yet at a buy signal crossover, but having funds on the sidelines after sidestepping the 20% drop from the 12.00s, makes it easier to make a decision to re-enter when the chart is saying the stock is oversold, rather than overbought. GLTA
 (0)
(0) (0)
(0)