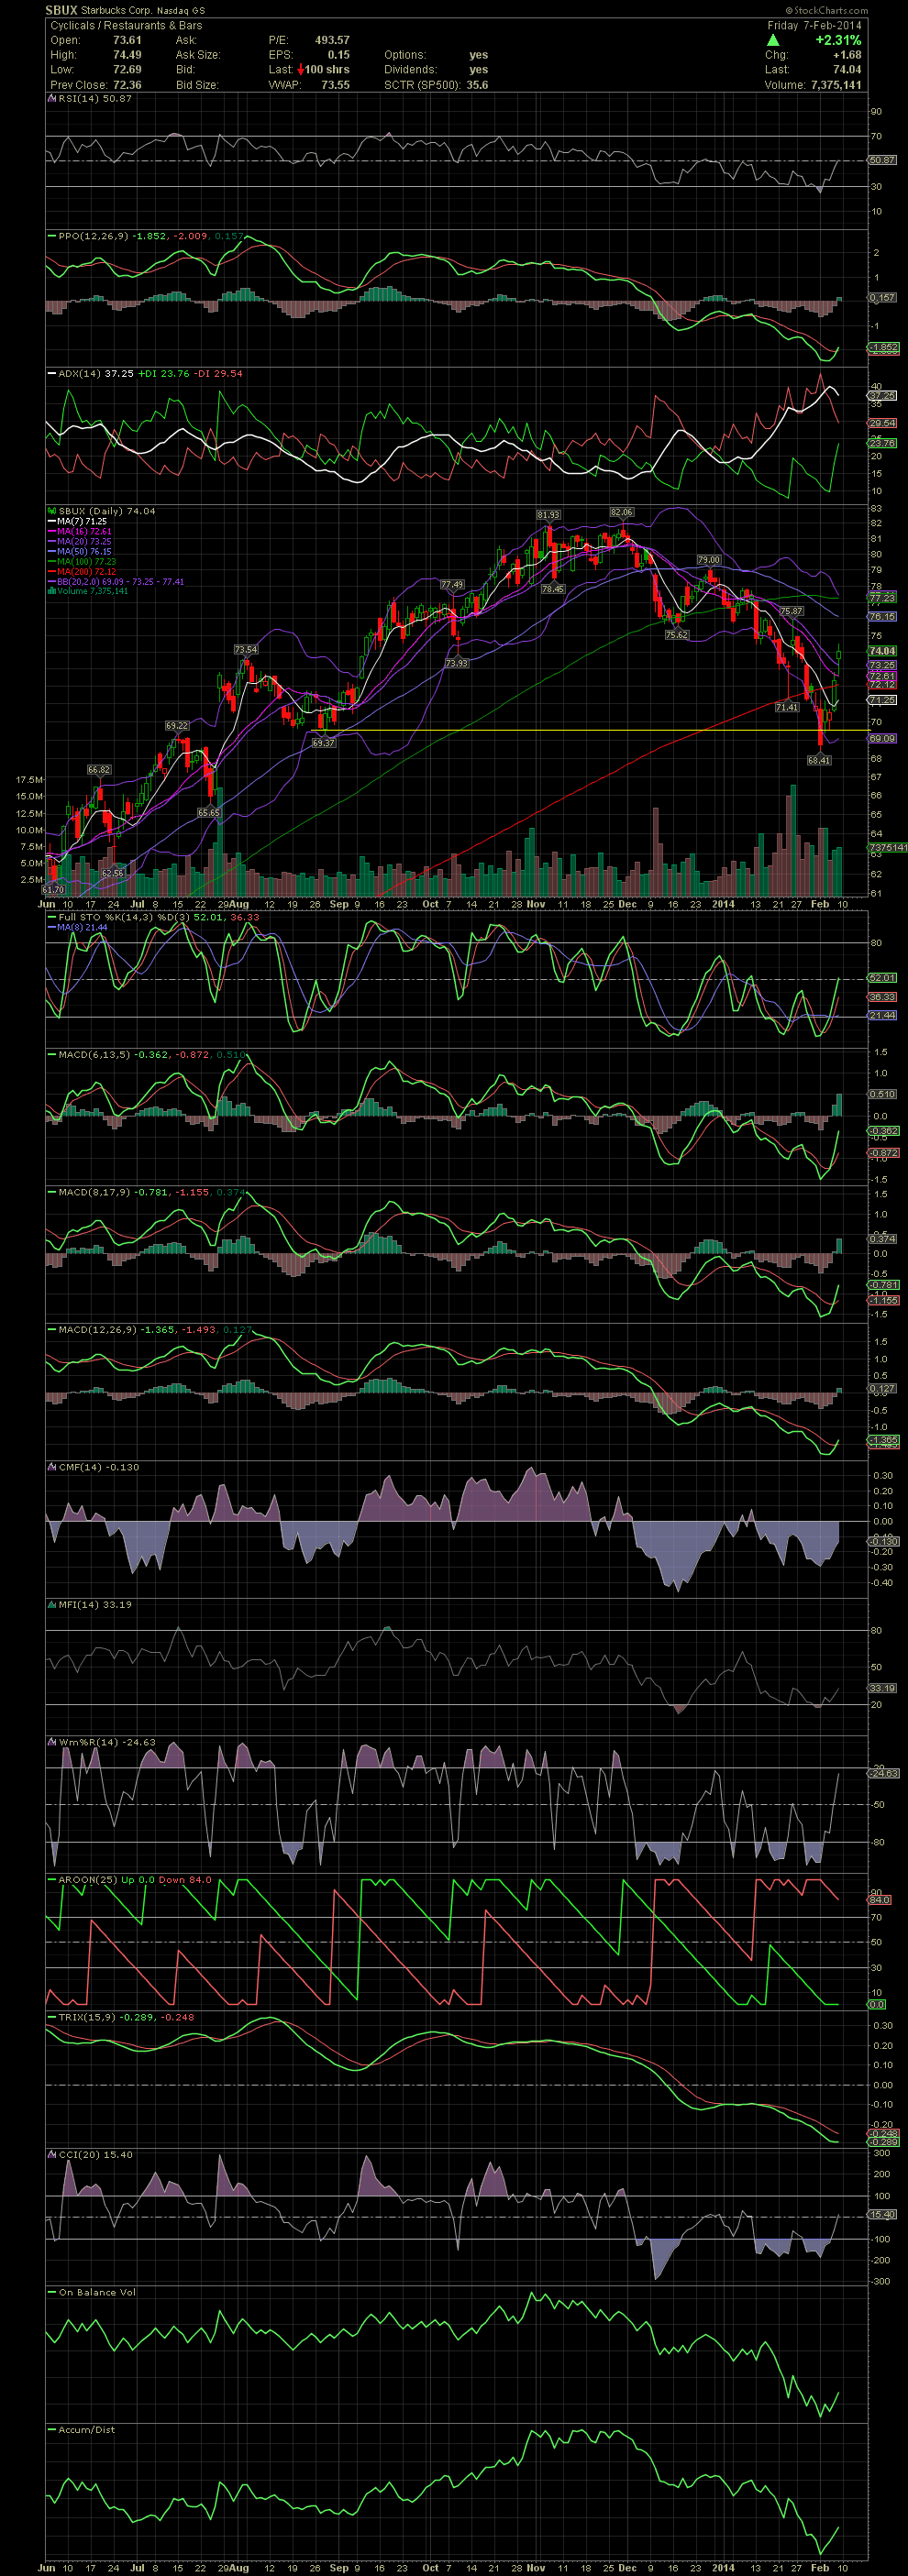
SBUX Daily Chart ~ Nice Decline to the Support Lin
Post# of 2561

After weeks of decline and breaking below all support levels, SBUX dropped into the horizontal support level of the 69.00s set in late August. The signals of the FullSto and MACDs in November, allowed a few to watch the pullback/correction into last week's low of 68.41. I know a few who banked on some puts, and now they've gone long with some in the money calls. Nice trading guys. The FullSto and MACDs have all crossed to the green now. If this reversal is real, next up will be the MA50 and 100 in the 76.00-77.00s. GLTA

 (0)
(0) (0)
(0)