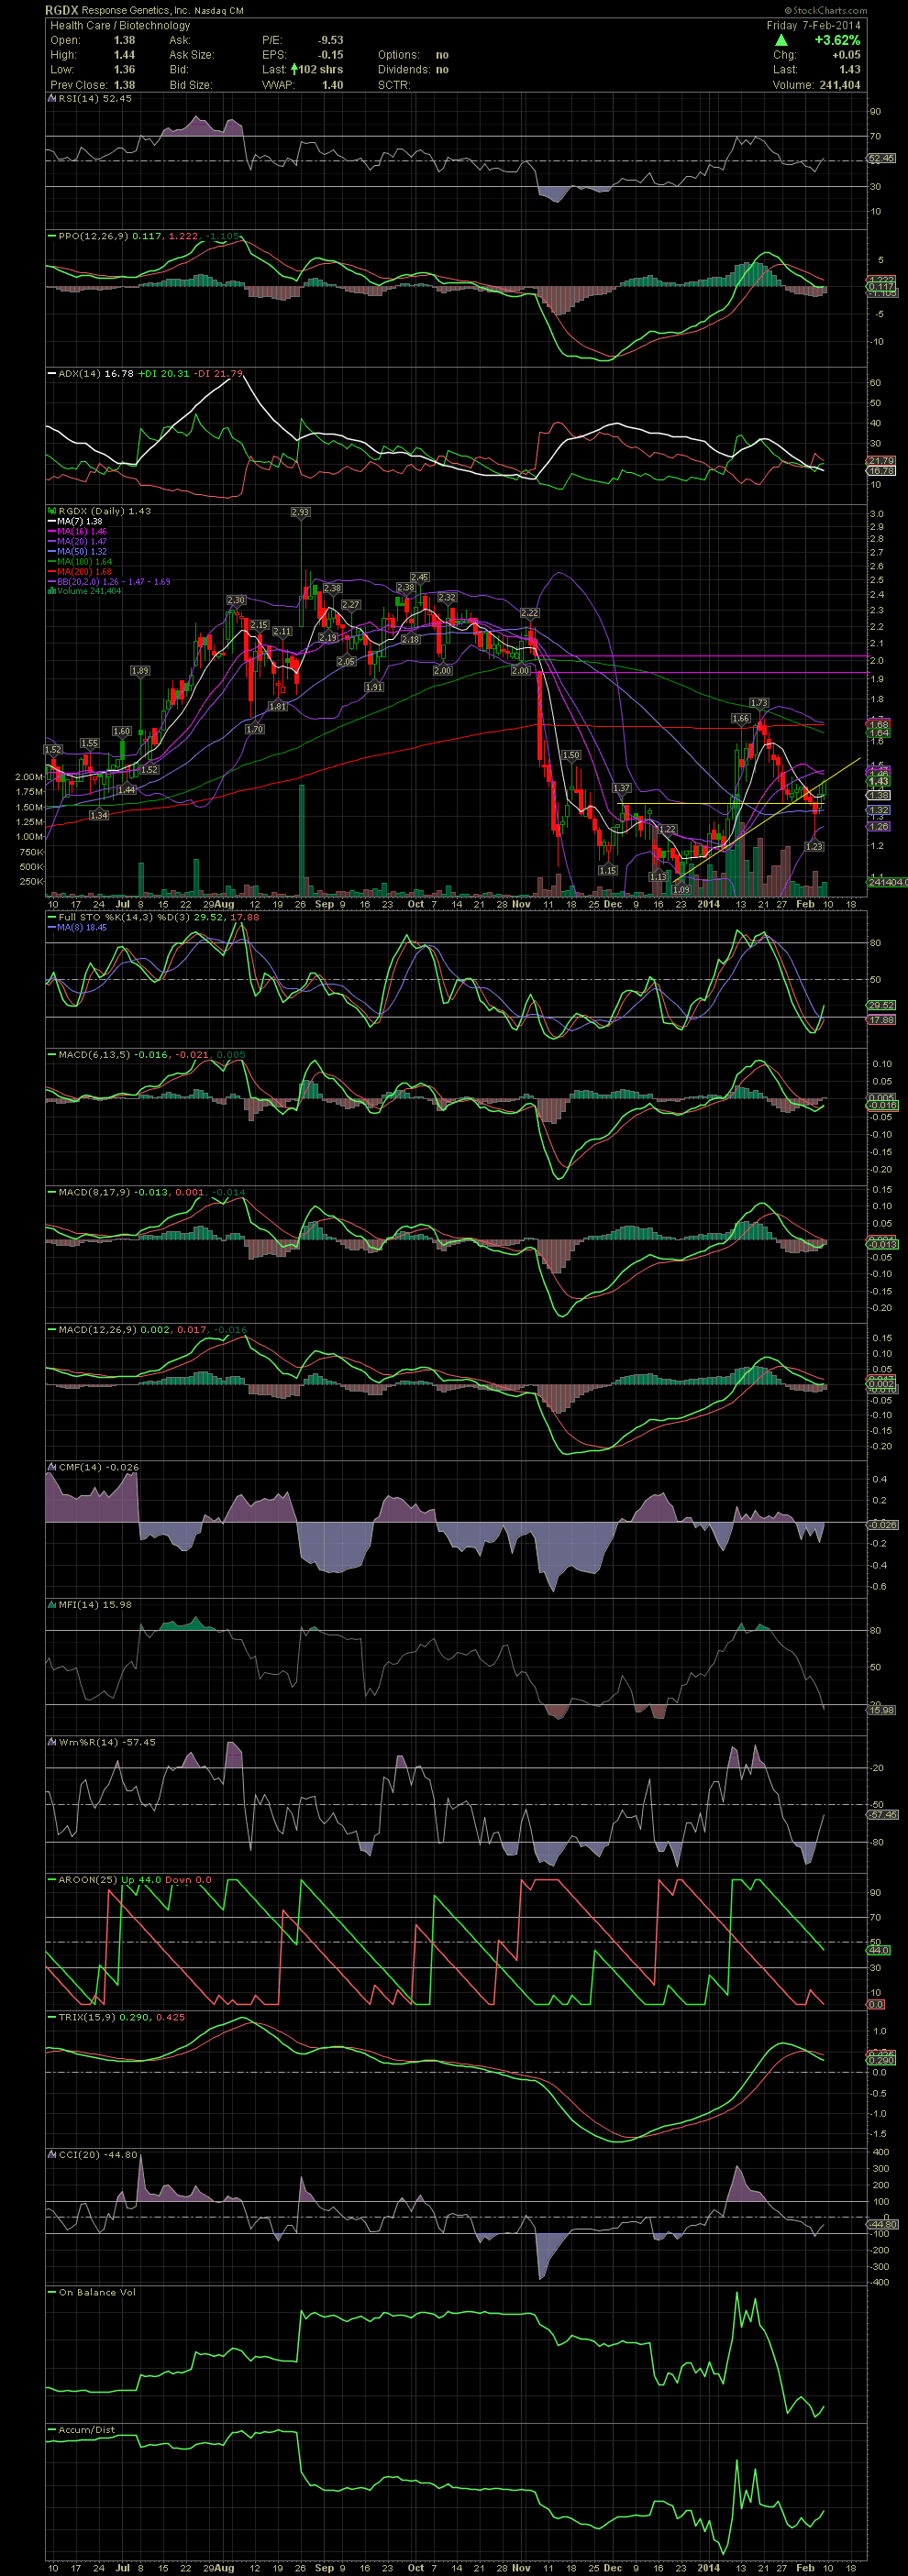
RGDX Daily Chart ~ Nice Reversal Off of Wednesday'
Post# of 2561
As I mentioned on Jan 29, I entered RGDX for 20,000 shares at 1.37 (link back). I should have added last week during the intraday selloff to 1.23 but I was too slow to move. A number of traders did do just that, and so far it was the right move. I entered when the stock appeared to be basing and getting support on the horizontal support line. The stock was also gradually moving higher on its rising support line. The decline under the MA50 more than likely triggered a few stop losses which resulted in a quick drop to the lower bollie at 1.23. The reversal on Thursday to move back above the MA50 was a good indication that the stock is ready to move higher again. Friday's close at the resistance point of the previous rising support line should be exceeded shortly. A close above the MA20 at 1.47, with higher volume, would suggest a trip to the MA200 at 1.68. In between here and the 200 is a declining MA10 currently at 1.64. The FullSto and MACDs are setting up for a confirmation of a new leg up. GLTA

 (0)
(0) (0)
(0)