Simple Moving Average (SMA) SKTO is trading abov
Post# of 36729
 (200x133).jpg)

Simple Moving Average (SMA)
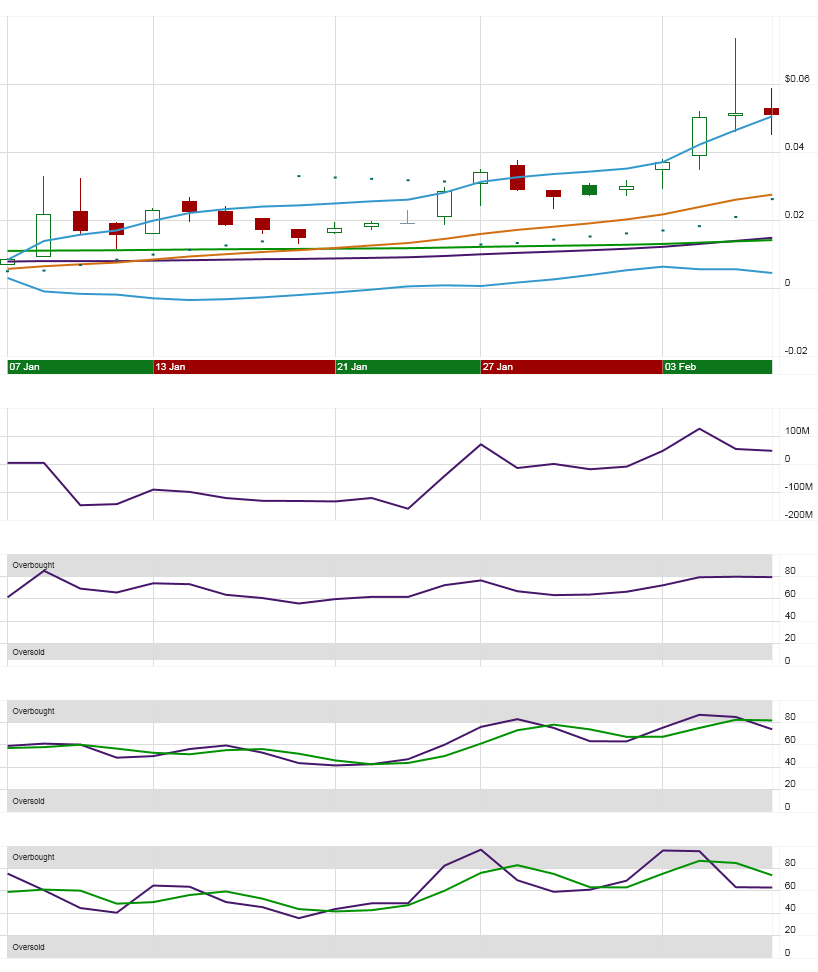
SKTO is trading above its 50 day simple moving average. This is considered to be the sign of a bullish trend. There is added weight to this indication because the moving average is rising and suggests that there has been buying interest in this stock.
Exponential Moving Average (EMA)
SKTO is trading above its 200 day exponential moving average. This is considered to be the sign of a bullish trend. There is added weight to this indication because the moving average is rising and suggests that there has been buying interest in this stock.
Bollinger Bands
SKTO is above the upper Bollinger Band, implying that it is currently extended from its recent trend. Be aware, however, that a cross outside of the Bollinger Bands can sometimes be a signal of trend strength and not, necessarily, trend reversal.
Parabolic Stop and Reverse (PSAR)
Thursday, SKTO closed above the trigger point for the Parabolic SAR and is currently registering a bullish signal. The current Significant Point, below which a reversal to the bearish side would occur, is 0.03.
Relative Strength Index (RSI)
The RSI, which is currently at 79.40% and above the critical level of 70, suggests that SKTO is overbought. While a stock that is overbought may continue to rally, investors should be especially careful when SKTO begins to lose strength and RSI dips below 70.
Stochastics
The Stochastic Oscillator is registering a bearish signal as the %K line has crossed under the %D and the oscillator recently crossed below the critical value of 80, moving from its overbought indication.
GO SKTO
GO BANK
GO MGMJ
"PEACE"
"Some more authentic market making "GIBBERISH".
 (0)
(0) (0)
(0)