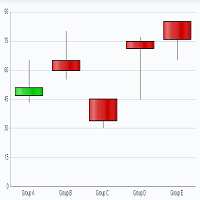
BBBY Stock Chart Mon, Feb 3rd, 2014
Post# of 338559

Period Moving Average Price Change Percent Change Average Volume
5 Day 11.74 -0.26 -2.23% 26,262,822
20 Day 11.21 +0.81 +7.66% 41,276,344
50 Day 10.35 +2.25 +24.64% 28,878,779
100 Day 9.51 +3.32 +41.19% 28,289,234
200 Day 8.85 +3.35 +41.72% 23,007,432
Year to Date 11.15 +0.75 +7.06% 39,112,379
Period Relative Strength Percent R Historic Volatility MACD Oscillator
9 Day 50.15% 91.26% 36.71% -0.17
14 Day 55.14% 43.52% 46.84% +0.08
20 Day 57.64% 37.75% 46.42% +0.40
50 Day 59.69% 28.48% 33.26% +1.27
100 Day 57.99% 20.89% 34.82% +2.10
 (0)
(0) (0)
(0)