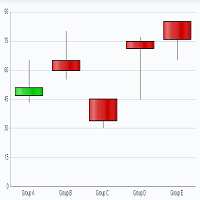
LVGI Stock Chart Sun, Feb 2nd, 2014
Post# of 338556

Period Moving Average Price Change Percent Change Average Volume
5 Day 0.0007 +0.0002 +40.00% 138,990,469
20 Day 0.0003 +0.0006 +600.00% 83,998,438
50 Day 0.0003 69,511,023
100 Day 0.0015 -0.0070 -90.91% 56,659,773
200 Day 0.5673 -8.6993 -99.99% 28,567,705
Year to Date 0.0003 +0.0006 +600.00% 80,488,133
Period Raw Stochastic Stochastic %K Stochastic %D Average True Range
9 Day 54.55% 51.52% 61.62% 0.0002
14 Day 54.55% 51.52% 61.62% 0.0002
20 Day 54.55% 51.52% 61.62% 0.0006
50 Day 54.55% 51.52% 55.27% 0.1405
100 Day 4.32% 2.67% 1.93% 1.3723
Period Relative Strength Percent R Historic Volatility MACD Oscillator
9 Day 65.08% 45.45% 637.75% +0.0001
14 Day 59.68% 45.45% 671.38% +0.0003
20 Day 41.44% 45.45% 697.92% +0.0003
50 Day 45.04% 45.45% 611.01% +0.0004
100 Day 48.93% 95.68% 498.27% -0.0008
 (0)
(0) (0)
(0)