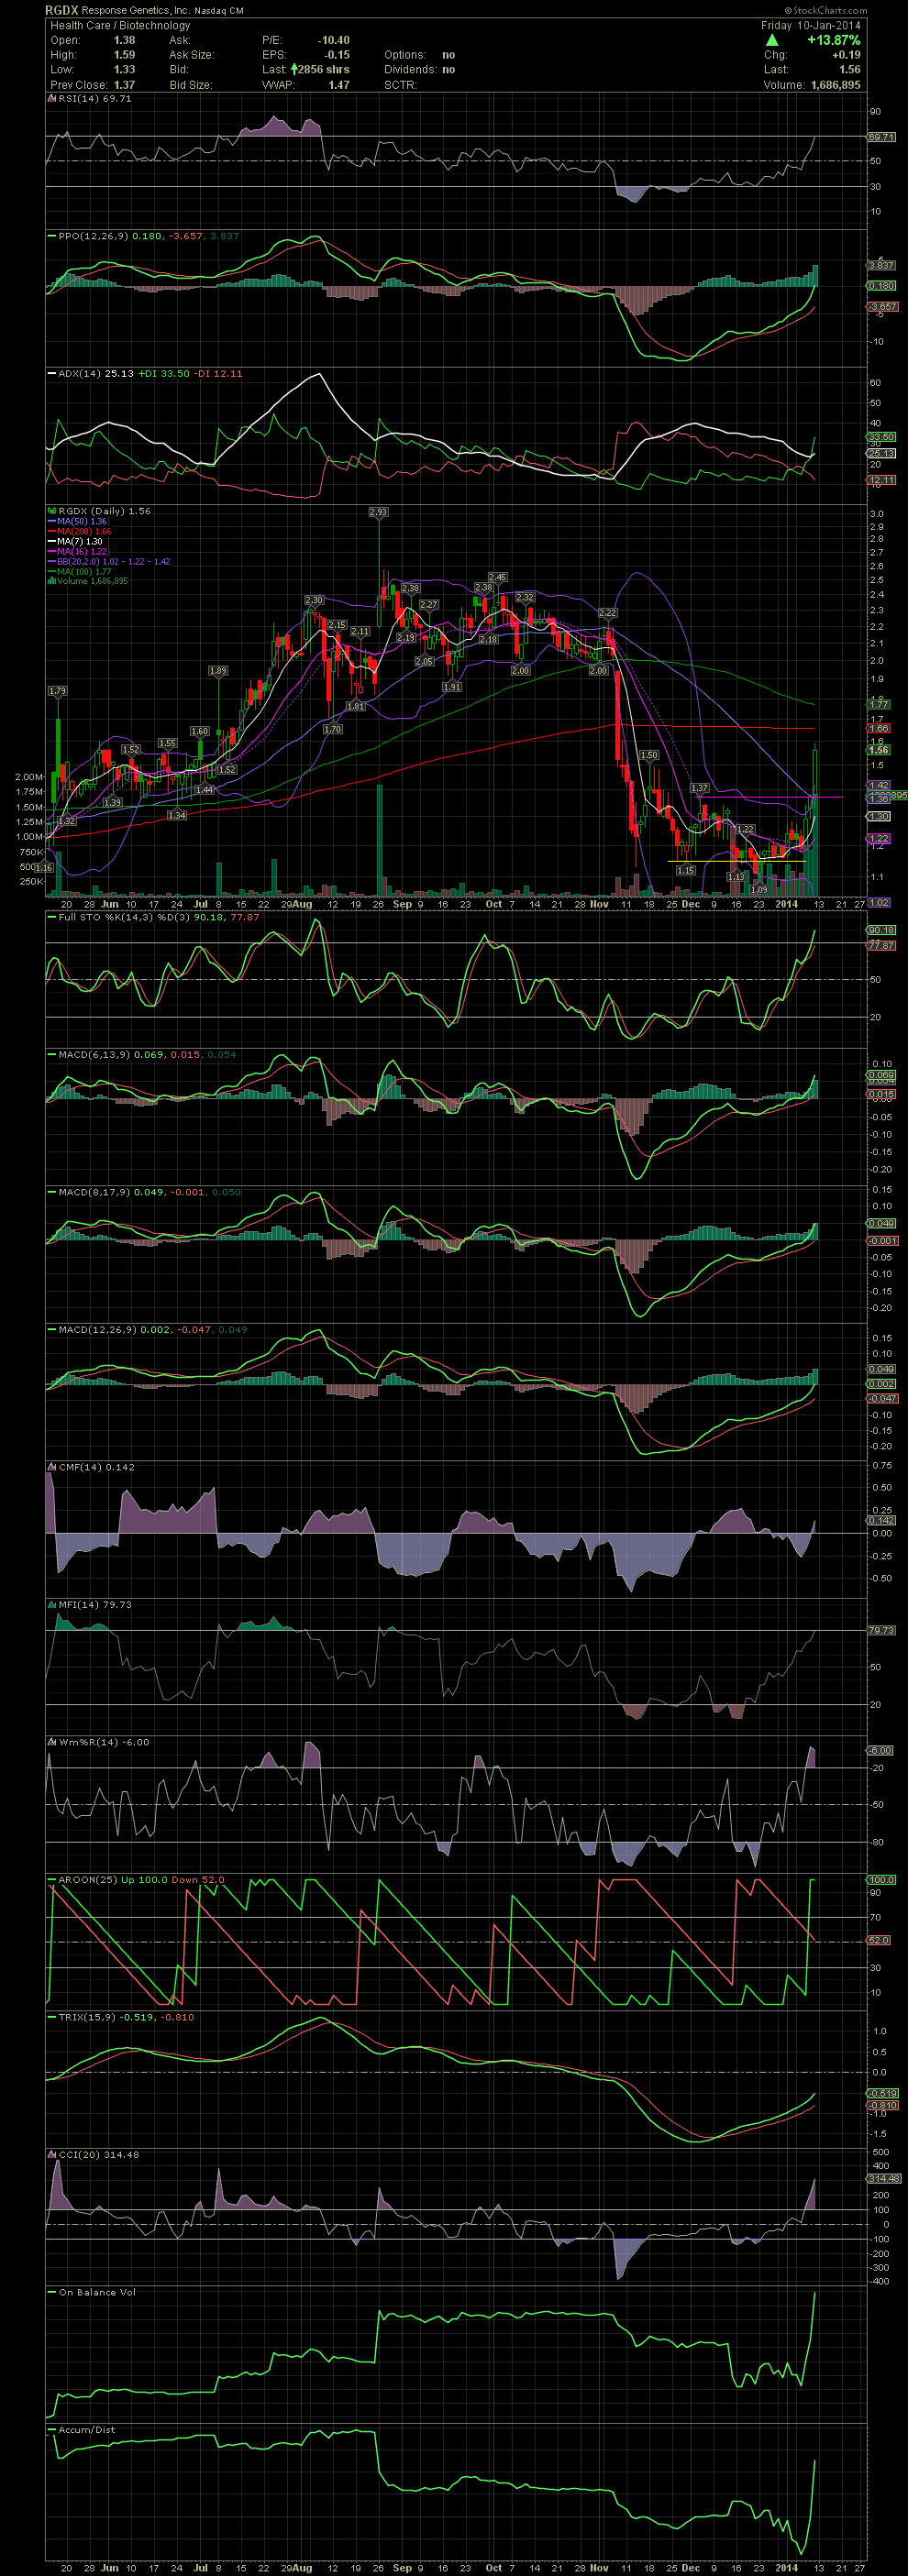
RDGX Daily Chart ~ Big Break Above the MA50 and Ho
Post# of 2561

I've had RDGX on watch for a few weeks at the 1.10s were offering support. Unfortunately, I didn't pull the trigger as the stock began trending up last week. Then came Friday. Not only did the stock breakout above the horizontal resistance but also moved strongly thru the MA50. I don't believe I'll chase it tomorrow morning, but for those in the stock, nice trade! Keep your eyes on the MA200 and 100. Get thru those two moving averages, and the stock should easily close the gap up to 2.00+. GLTA

 (0)
(0) (0)
(0)