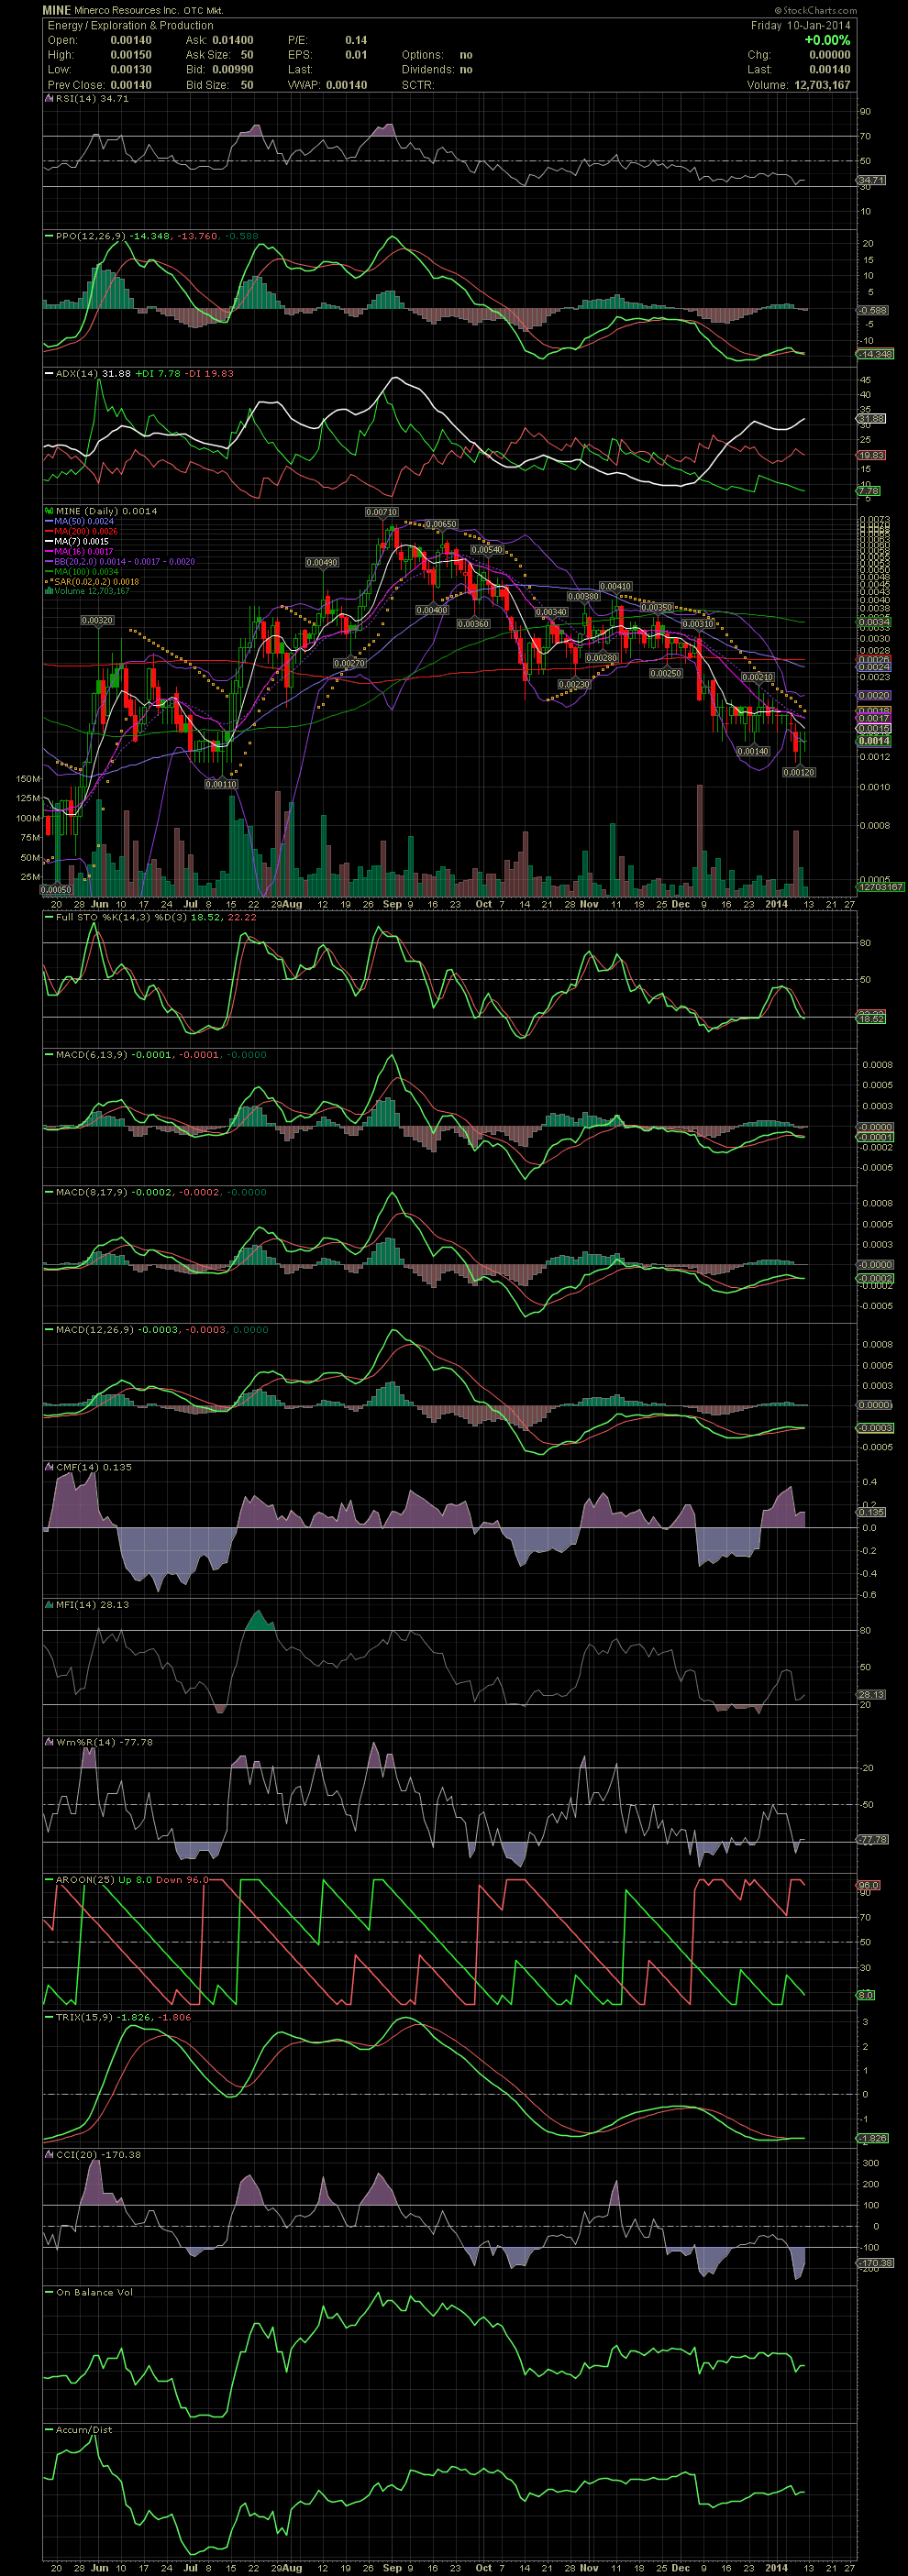
MINE Daily Chart ~ Breaking Lower Once Again I
Post# of 2561

I haven't been in MINE for since mid November when the stock was building another top as in Sept. Management just can't seem to stop with the toxic financing, and here's your long term results below. The only reason I'm putting up a MINE chart is because it's a great learning tool when it comes to following the various crossovers of the FullSto and MACDs, along with knowing what typically occurs when a stock breaks below moving averages such as the MA20, 50 and 200. First, study the chart below and follow the MA50 when the stock moved above it as support and finally below it when the 50 then became resistance. The stock broke under the 50 in early October which resulted in a quick decline. As the stock began to recover a bit, notice the three attempts to get back above the 50 in Nov. Additionally, the stock found support on the MA200 from mid Oct to early Dec. When the share price fell below the 200, the rout was on. Since then, a weak attempt to break above the horizontal resistance at .0018 failed last week, and the stock fell to a low of .0012. I know quite a few individuals who are still holding MINE, and I truly wish them well. But even putting lipstick on this pig......... well, it's still a piggie. With a lot more toxic debt on the way, MINE could easily trade its way into the trips which is was when I first bought a few. Very disappointing, but the negative crossovers in early Sept but a halt to the great move of the weeks before. GLTA

 (0)
(0) (0)
(0)