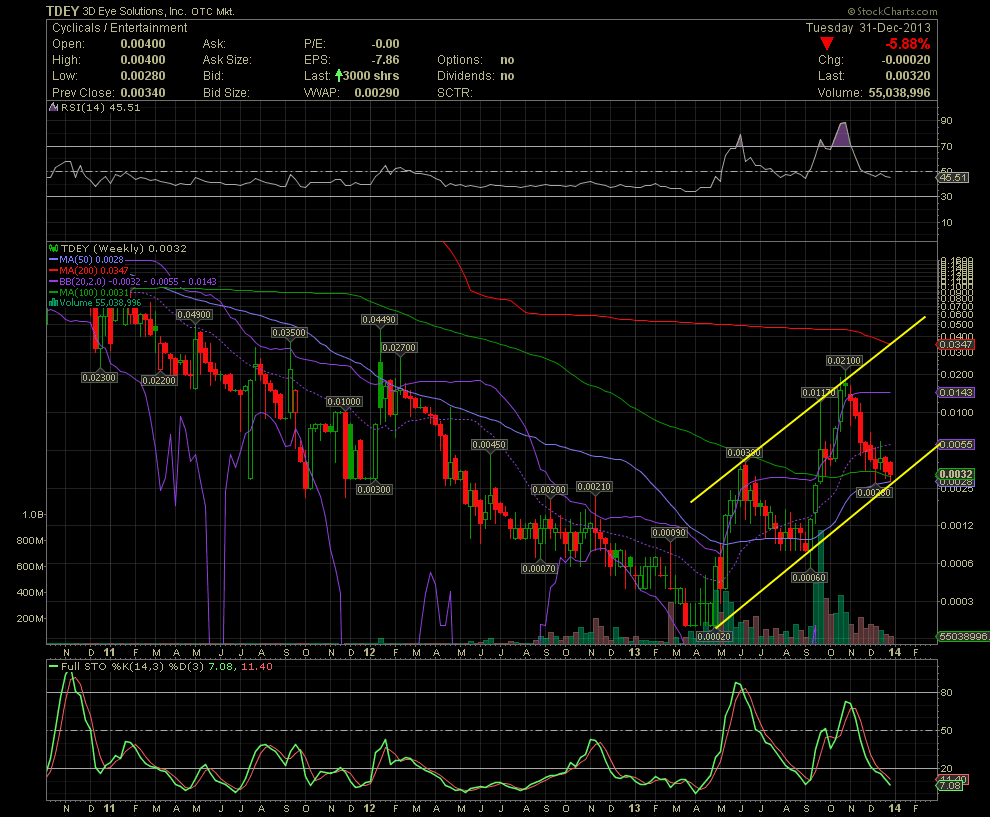
TDEY Weekly Chart ~ An Interesting Picture of Trad
Post# of 2561

Here you go. If anyone is looking for a calculated risk/reward entry into TDEY, this Weekly Chart just might be of assistance to you. The selling volume has fallen off weekly over the last couple of months. The stock is hanging on to the MA50 and 100 while the rising support line is right there. GLTA

 (0)
(0) (0)
(0)