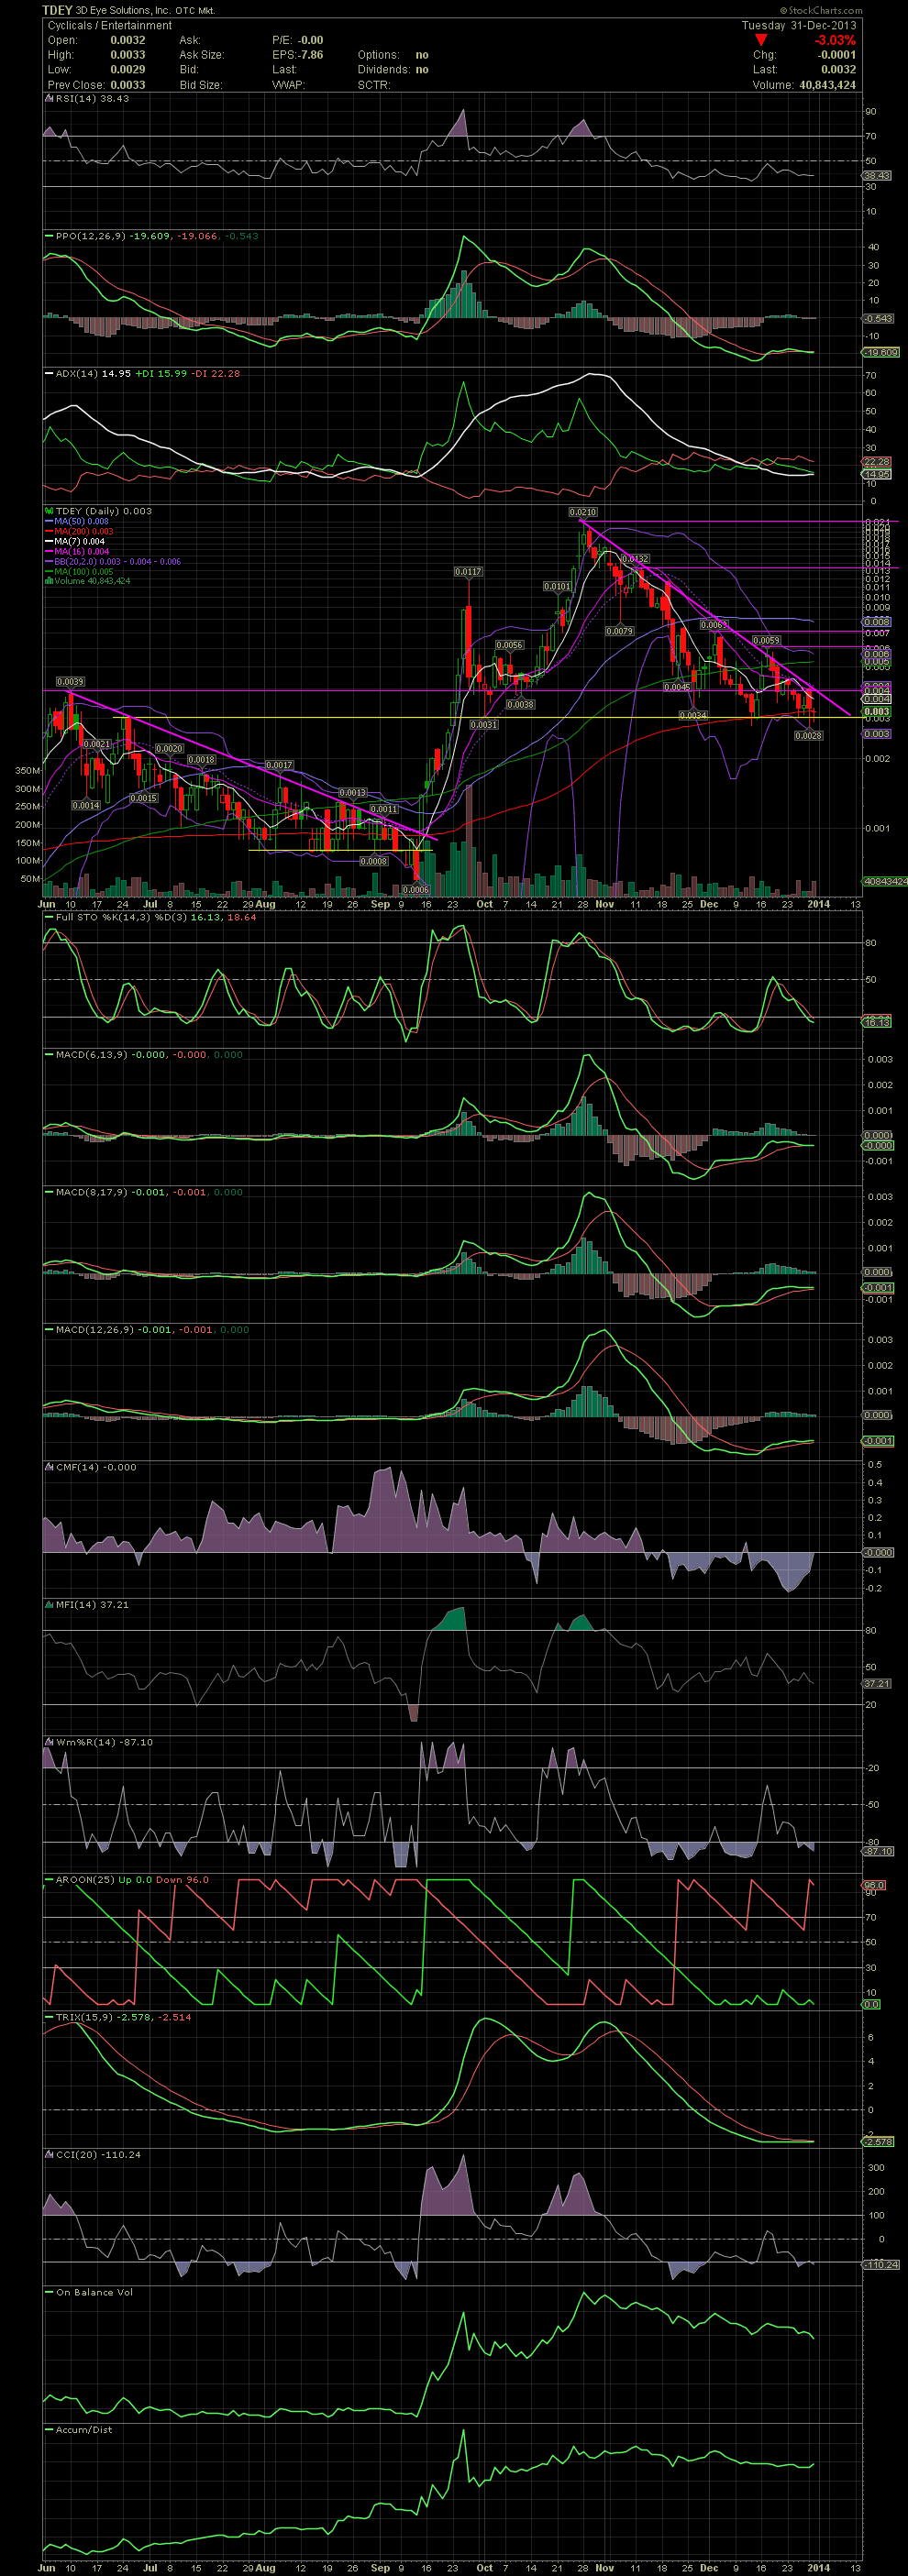
TDEY Daily Chart ~ A Similar Setup.....Is The Bott
Post# of 4425
Anyone who follows technical analysis knows that every chart has it's own trading patterns. Understand that and you can easily spot when an entry point is there. What I've noted on the chart below is a number of horizontal support (yellow) and resistance (pink) points. I've also drawn in the two multi month declining tops lines. The first occurred back in June thru mid Sept. Notice the declining line in pink and the support line in yellow when the stock was bottoming at .0008. Move forward to the second set of lines beginning on the end of October into the current levels. Once again, note the declining tops line and the support base right at .003. Also of interest is the MA200. Look how the stock hugged it previously and again over the last couple of weeks. The FullSto and MACDs in oversold territory and getting set up for a positive crossover. Any material news released over the next week will turn TDEY up sharply imo. Looks like a great entry for those who haven't taken a position yet. GLTA

 (0)
(0) (0)
(0)