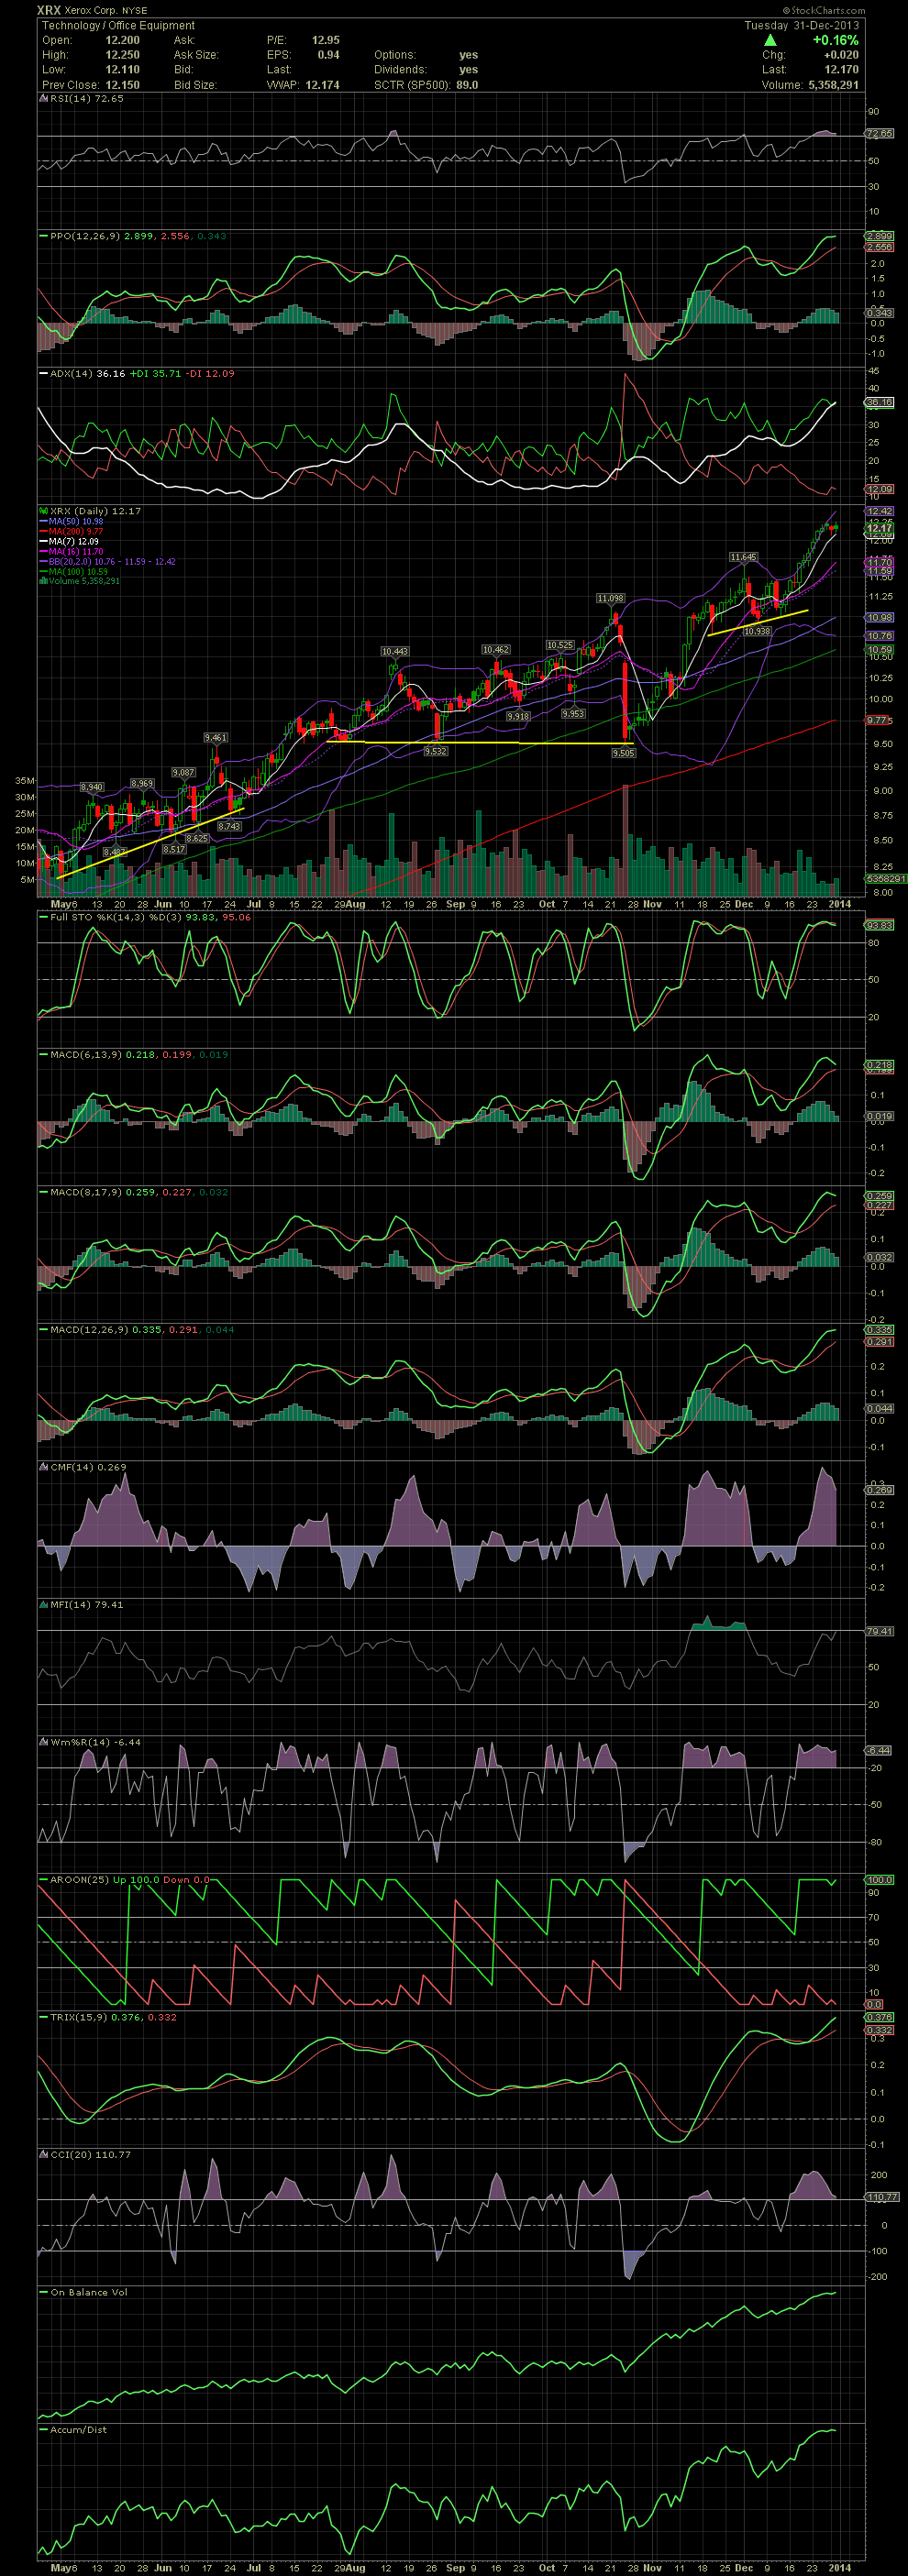
XRX Daily Chart ~ Close to a Short Term Top? I'm
Post# of 2561

I'm close to exiting XRX up here. What probably will amount to nothing more than a short term consolidation or pullback period, one still has to stay aware of locking in profits when the charts give you the hints of a momentum shift. XRX has treated us well with our more conservative funds. I'm still laughing at the fund sheeples who ran out the door back in late October when XRX stock was have a major sale on its stock price. It was nice of those guys to dump XRX right into our waiting hands. Why were we waiting at 9.50? Simple. Take a look at the double bottom support line which I drew in back in late August after that bottom was established. The leg up in late July was the start point of that double bottom. Anyone could have drawn in that line back in August. Yet look where the XRX Stock Discount Sale took us to in October. Right to our support line. If you were ready, it would have taken some cajones to catch that falling knife. But at support levels, one needs to step in front of that knife and catch it. Although XRX hasn't violated the upper bollie, notice the smaller candles of the last week. The momentum to the upside is ebbing, and the FullSto and MACDs are beginning to curl to the downside. I can pretty much say that I'll be selling the stock in the next day or two barring any earth shattering news which might give the stock a push for a day or two. The smaller move of the last week could also be the fund manager sheeple buying into XRX to pretend that they've been invested in the stock for months. Keep in mind, it's not disclosed in their quarterlies when they entered, only that they own a stock. Anyway, I'll let the chart and technicals do the talking . GLTA

 (0)
(0) (0)
(0)