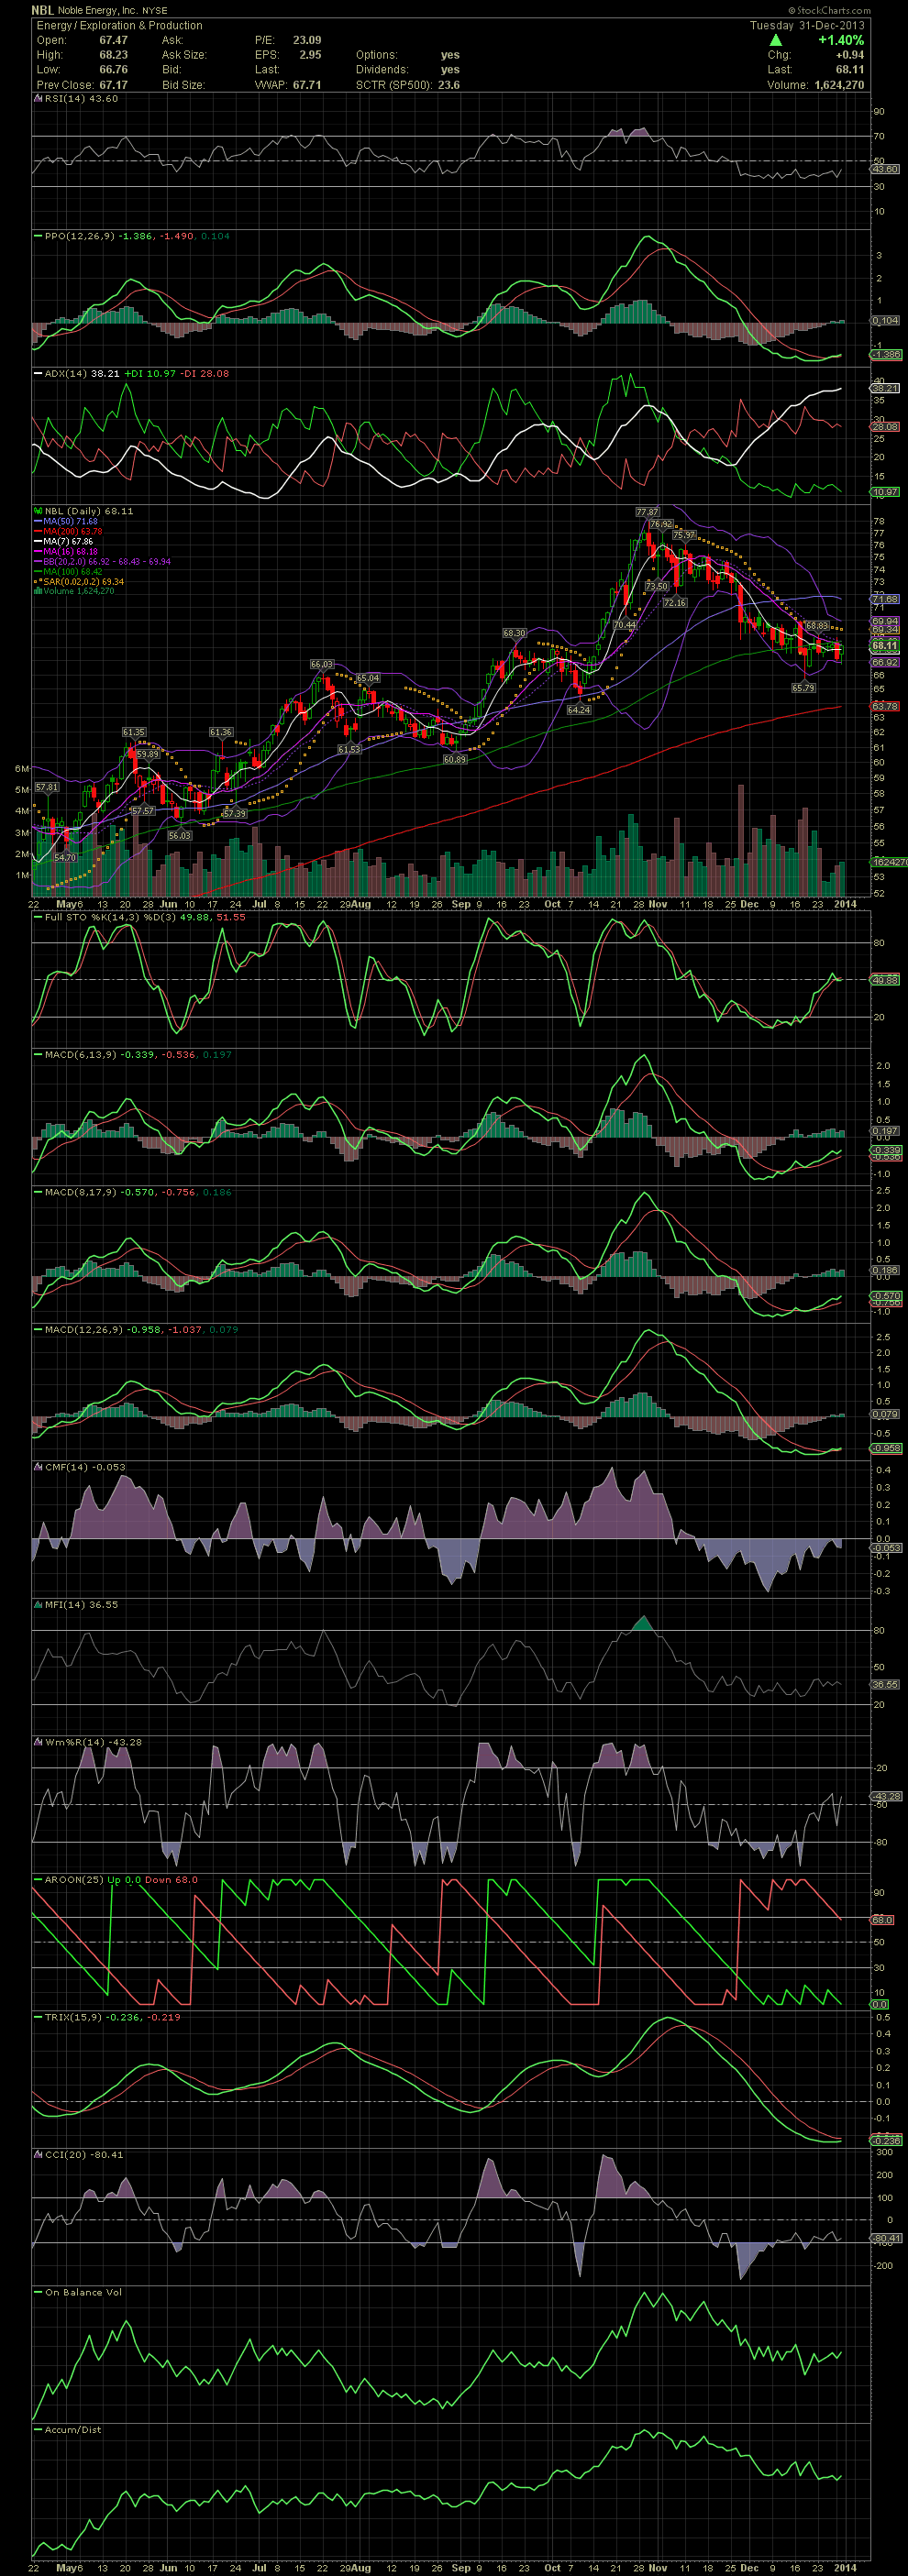
NBL Daily Chart ~ Looking Like It's Ready for a Mo
Post# of 2561

NBL declined from the almost 78.00 to just under 66.00. Over the last two weeks, the stock has started to consolidate in the 67.00-68.00s as the indicators are resetting from negative levels. The FullSto and MACDs began positive crossovers a few days ago and some separation is beginning to show. The stock has been hugging the MA100 while the MA7, 10, 16 and 20 have started to level out. I'm thinking about some in the money calls vs just buying a couple of hundred shares. With the price of oil back at $100, odds are this exploration company with a cost of under $20.00 per well, has a lot of money flow coming into the company. But I'll still rely on the chart and momentum for my moves. GLTA

 (0)
(0) (0)
(0)