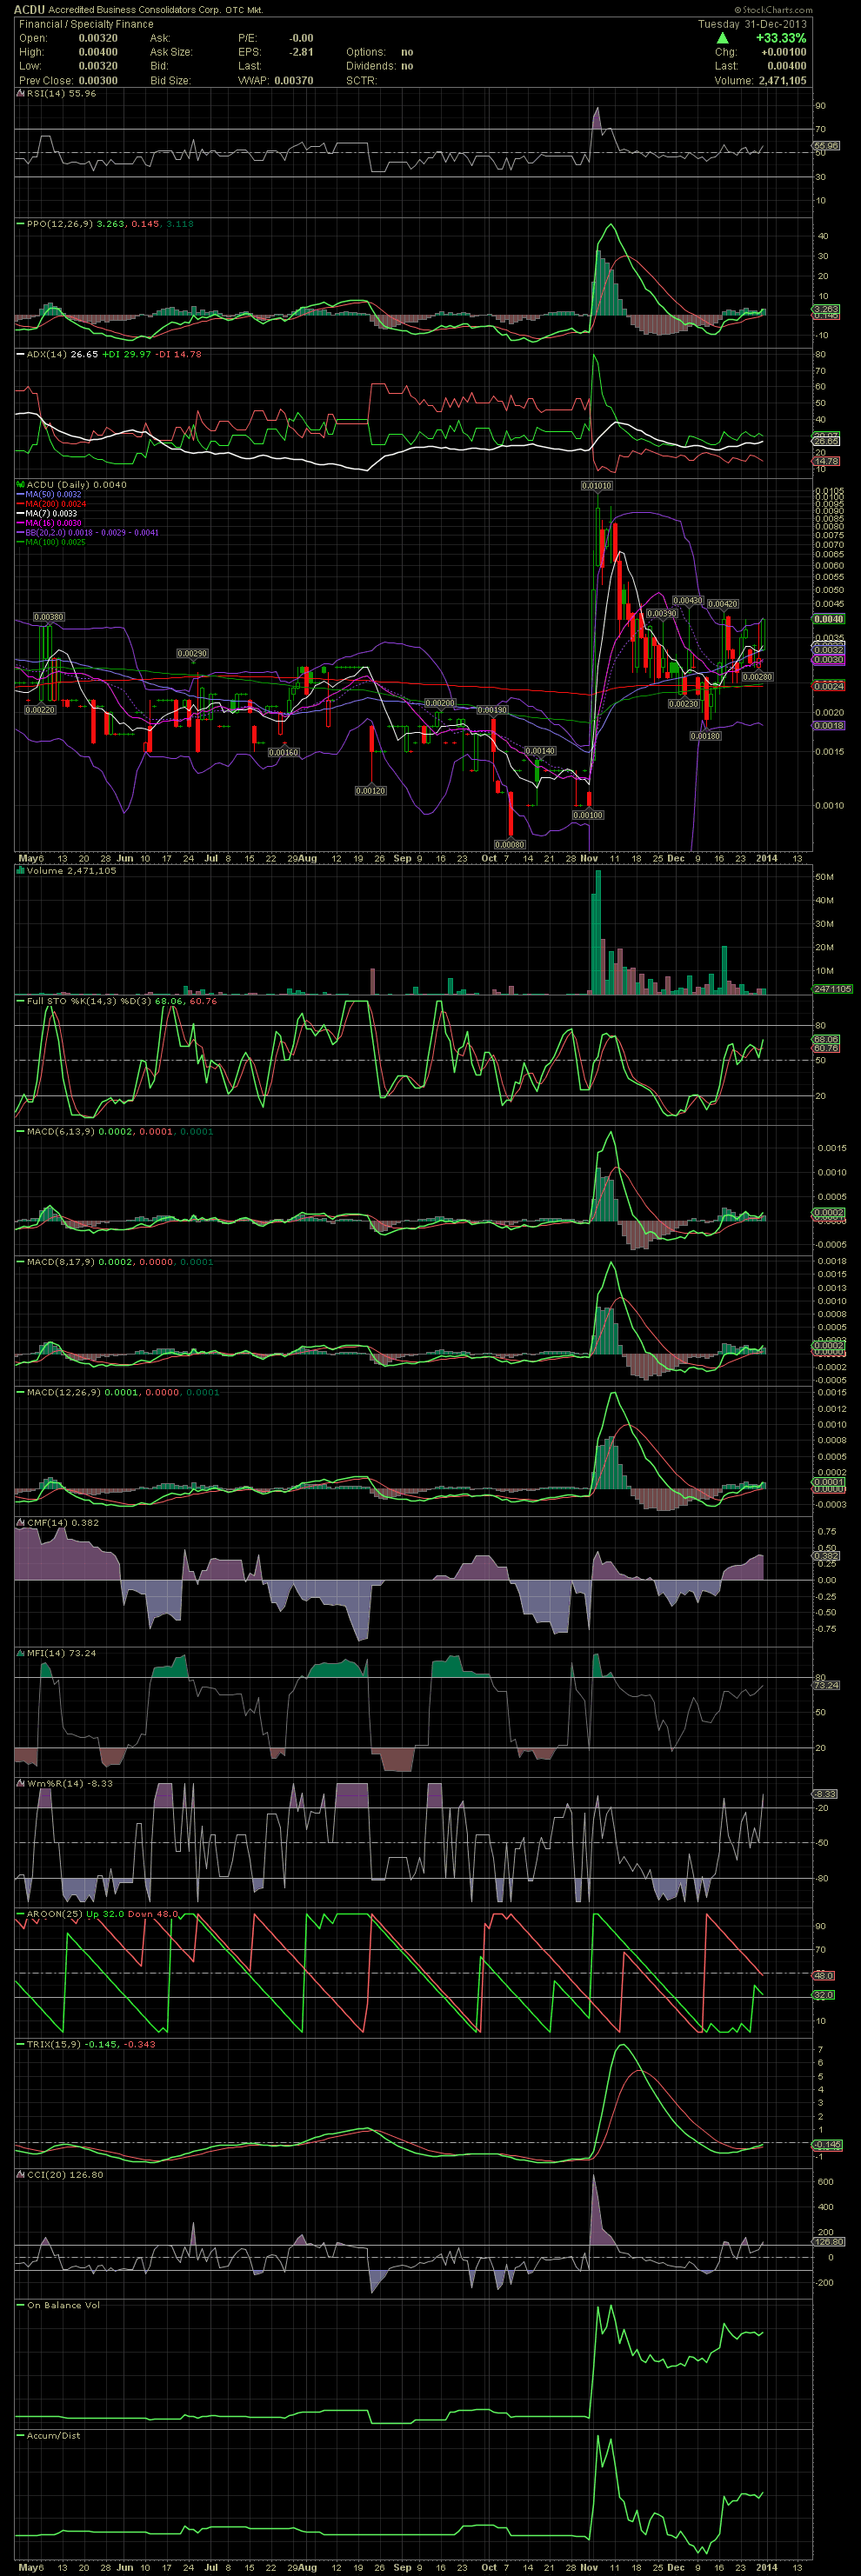
ACDU Daily Chart ~ Nice Setup for a Breakout I m
Post# of 2561

I missed the first run back in November, but swing traded from .003 to .0041 and back in last week at .003. As you can see, the stock is back to its previous intraday high of .0042 but closed at its highest point since the run in November. HIgher lows since the selloff into early December. MACDs are showing a positive crossover. Hearing strong updates coming from the company. While some are screaming .10+, I'll be happy with a break to a new high and will be using the chart for exits and possible re-entries. GLTA

 (0)
(0) (0)
(0)