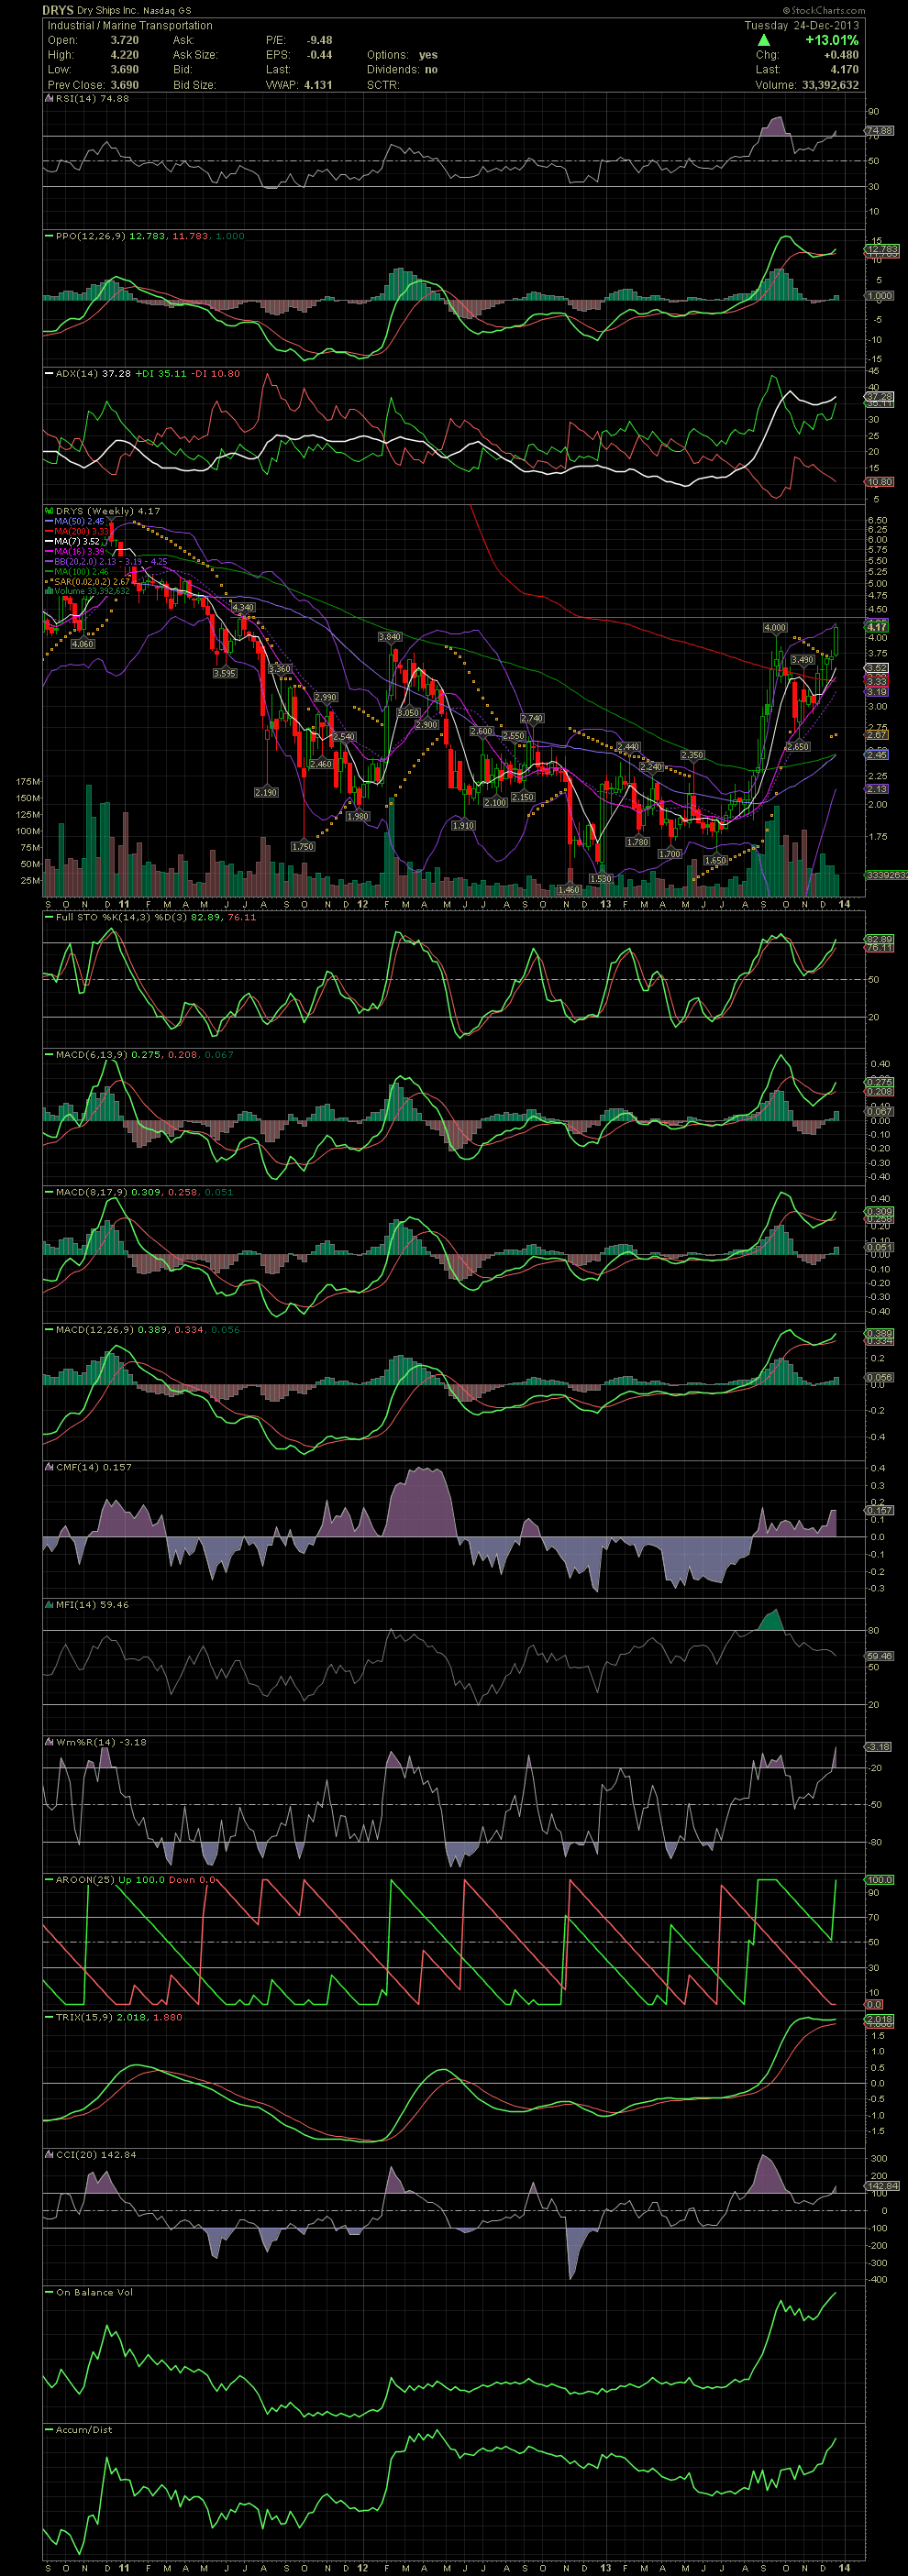
DRYS Weekly Chart ~ Next Target is $4.30 The wee
Post# of 2561

The weekly chart shows the large volume that has been pouring into DRYS over the last few months as the stock is approaching 2.5 year highs. It's always good to check on your weekly chart for possible targets once your daily charts begin hitting new annual highs. In the case of DRYS, the next target would be the horizontal resistance point of the high placed in late June/early July of 2011. We'll check on the further upside potential should we see the 4.30 taken out. But at the moment, I'm thinking 6.50 could easily been seen in 2014. GLTA

 (0)
(0) (0)
(0)