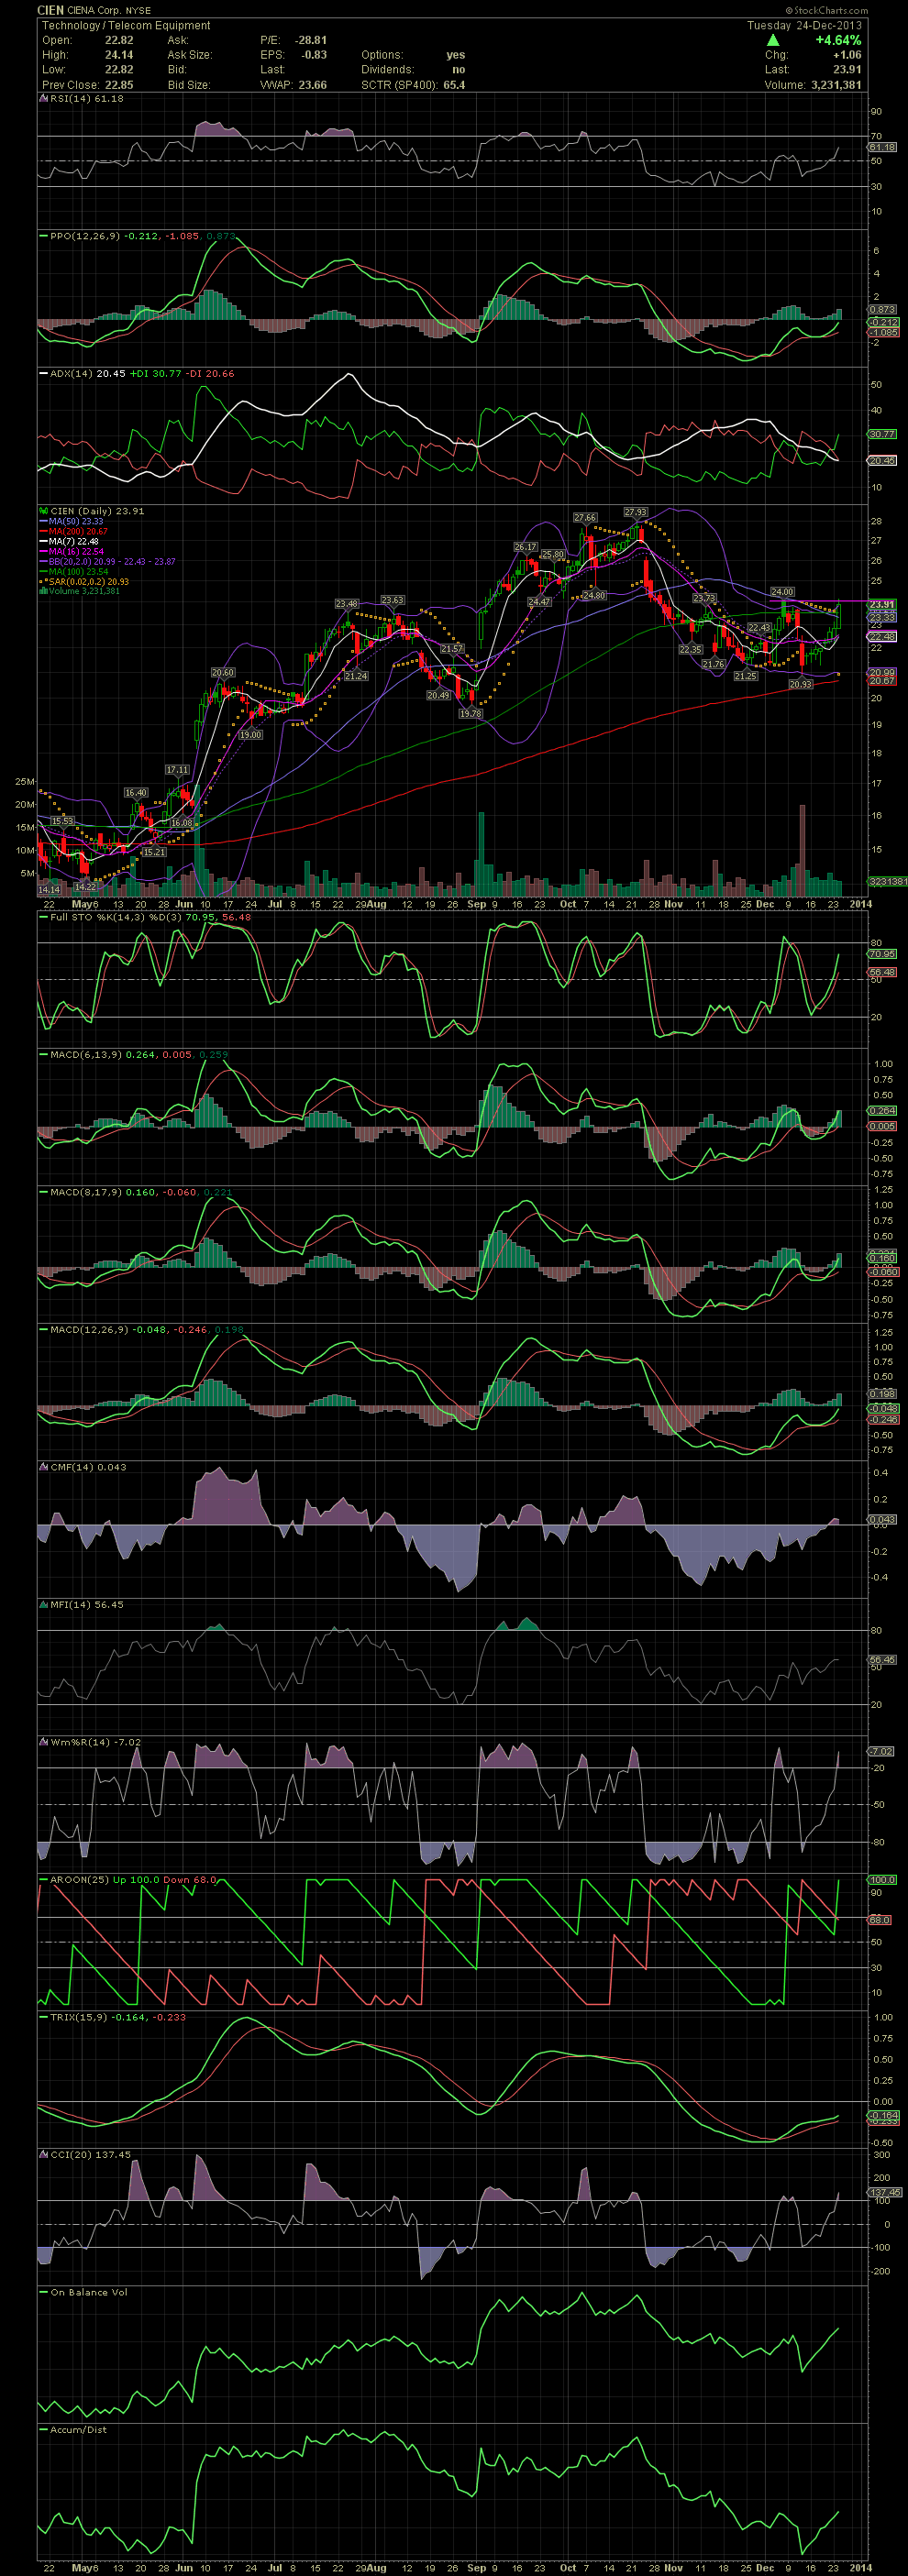
CIEN Daily Chart ~ Close to The last few days
Post# of 2561
The last few days has seen CIEN move above the MA7, 10, 16, 20. Tuesday the stock closed above the important 50 and 100 moving averages. We also saw the first attempt to break above the horizontal resistance point of 24.00. A move over that target and the stock could close the small gap up to 27.00 and possibly hit a new high of 27.94+. Sounds like a few of you jumped on board late last week in the 22.00 area along with two friends that bought the 20.00 call options. Nice job! GLTA

 (0)
(0) (0)
(0)