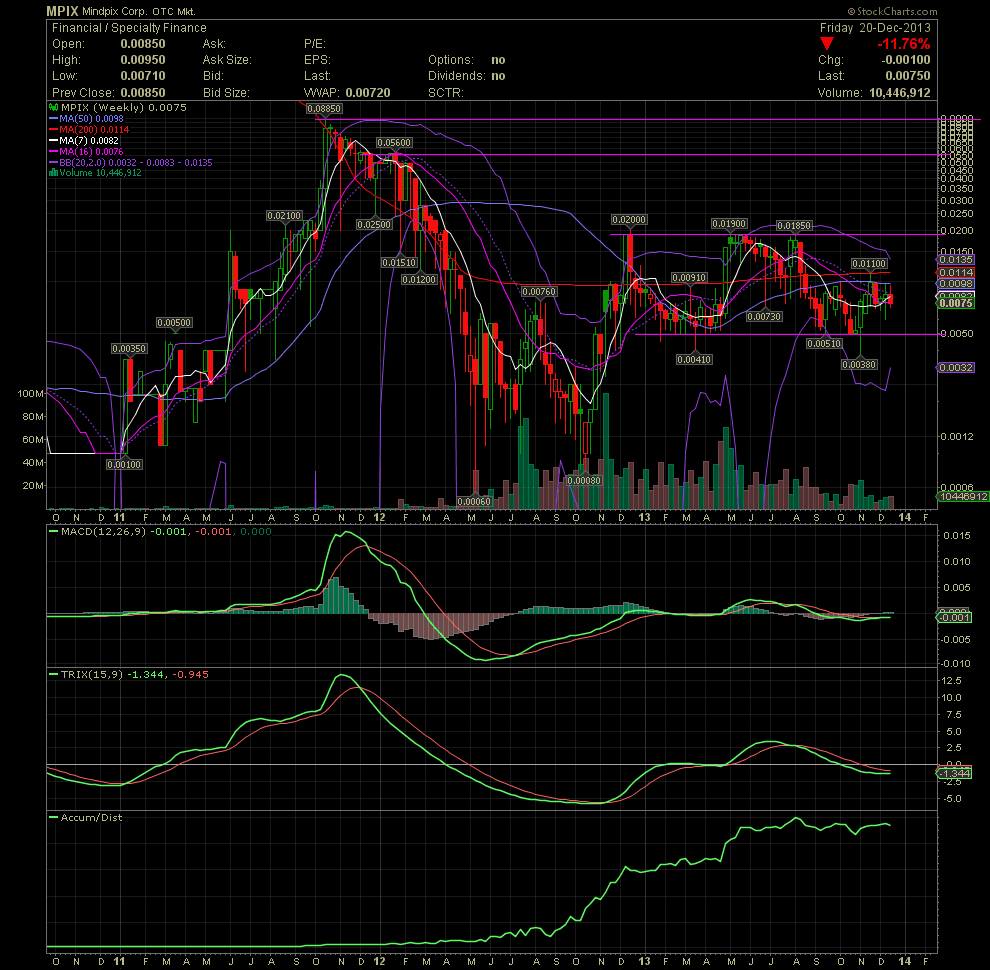
MPIX Weekly Chart ~ Tick Tock......... There re
Post# of 5570

There really is nothing new to share as far as technicals go on my favorite penny stock, MPIX. Here's just another Weekly Chart to allow the history of MPIX to be told with a chart. The loyal longs simply suffered through months and months of dilution and share dumpage by the previous management team. It's quite easy to see on the chart below. It began in May 2012 and continued for months and months as the OS climbed from under 400 mil to almost 1.5 billion. As the share printing machine of past days began to run out of steam, the volume has been tailing off for months. As one can see on the AD line, those shares continued to be accumulated and are being held tightly. I'm sticking with my opinion that the triple top will be taken out easily on when the next move is upon us. Once that finally occurs, the two horizontal resistance targets of .056 and .0085 should be the next anticipated levels of resistance. With the anticipated audited financials, the SEC S-1 registration, an uplist to the QB, and numerous projects/events/partnerships, along with the strong management team being installed, MPIX is being set up for a huge move to the upside imo. Got MPIX?!!!! GLTA

 (0)
(0) (0)
(0)