NURO Daily Chart ~ Entering on Those Huge Gaps to
Post# of 2561
Posted On: 12/16/2013 2:00:09 AM

NURO Daily Chart ~ Entering on Those Huge Gaps to the Upside a Good Bet? Rarely
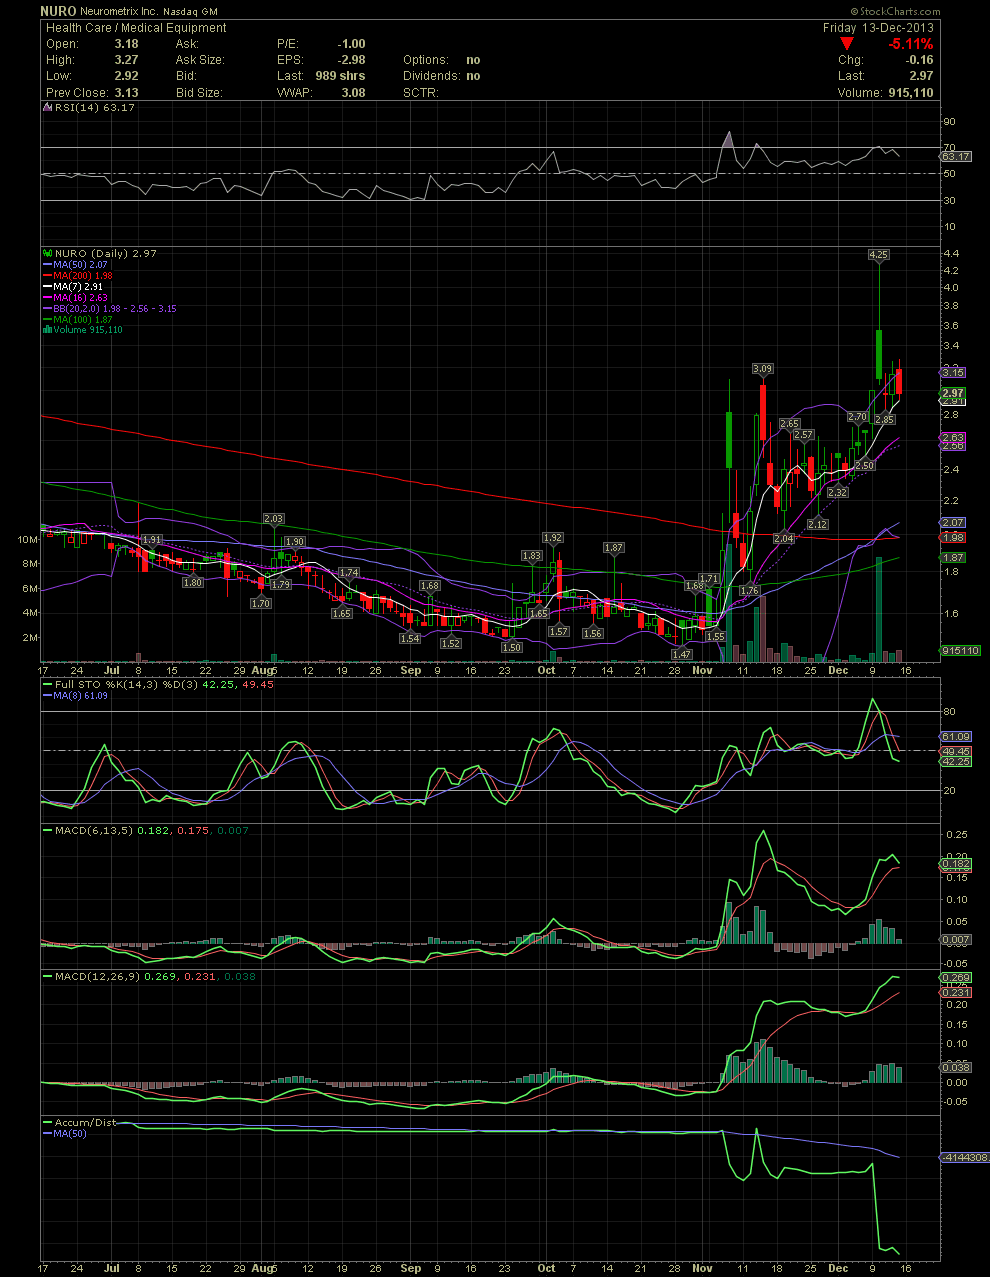
I received four requests for a chart and thoughts on NURO. The stock has obviously been in a strong uptrend. That still means one has to pay attention to ones entry points when adding to a position. Many have heard me talk about what normally happens when a stock candle trades completely outside the upper bollies. NURO offers up four separate examples in just an eight month period. Chasing a stock when the share price gaps up is a tough call. But chasing a stock that is gapping up with the share price way outside the upper bollie is almost always an expensive lesson. A quick look at this NURO chart shows that what goes outside the bollie, always comes back inside the bollie. Those that purchased NURO as high as 3.09 in early November are now still sitting on a loss, unless they sold this last Tuesday when the stock gapped up and traded to 4.25. Those that chased last Tuesday's news into that one day move are almost all sitting on a short term loss. Many times the best trade is no trade at all. Follow the charts and indicators to better time your entries and exists if you are swing trading a stock. GLTA
I received four requests for a chart and thoughts on NURO. The stock has obviously been in a strong uptrend. That still means one has to pay attention to ones entry points when adding to a position. Many have heard me talk about what normally happens when a stock candle trades completely outside the upper bollies. NURO offers up four separate examples in just an eight month period. Chasing a stock when the share price gaps up is a tough call. But chasing a stock that is gapping up with the share price way outside the upper bollie is almost always an expensive lesson. A quick look at this NURO chart shows that what goes outside the bollie, always comes back inside the bollie. Those that purchased NURO as high as 3.09 in early November are now still sitting on a loss, unless they sold this last Tuesday when the stock gapped up and traded to 4.25. Those that chased last Tuesday's news into that one day move are almost all sitting on a short term loss. Many times the best trade is no trade at all. Follow the charts and indicators to better time your entries and exists if you are swing trading a stock. GLTA

 (0)
(0) (0)
(0)