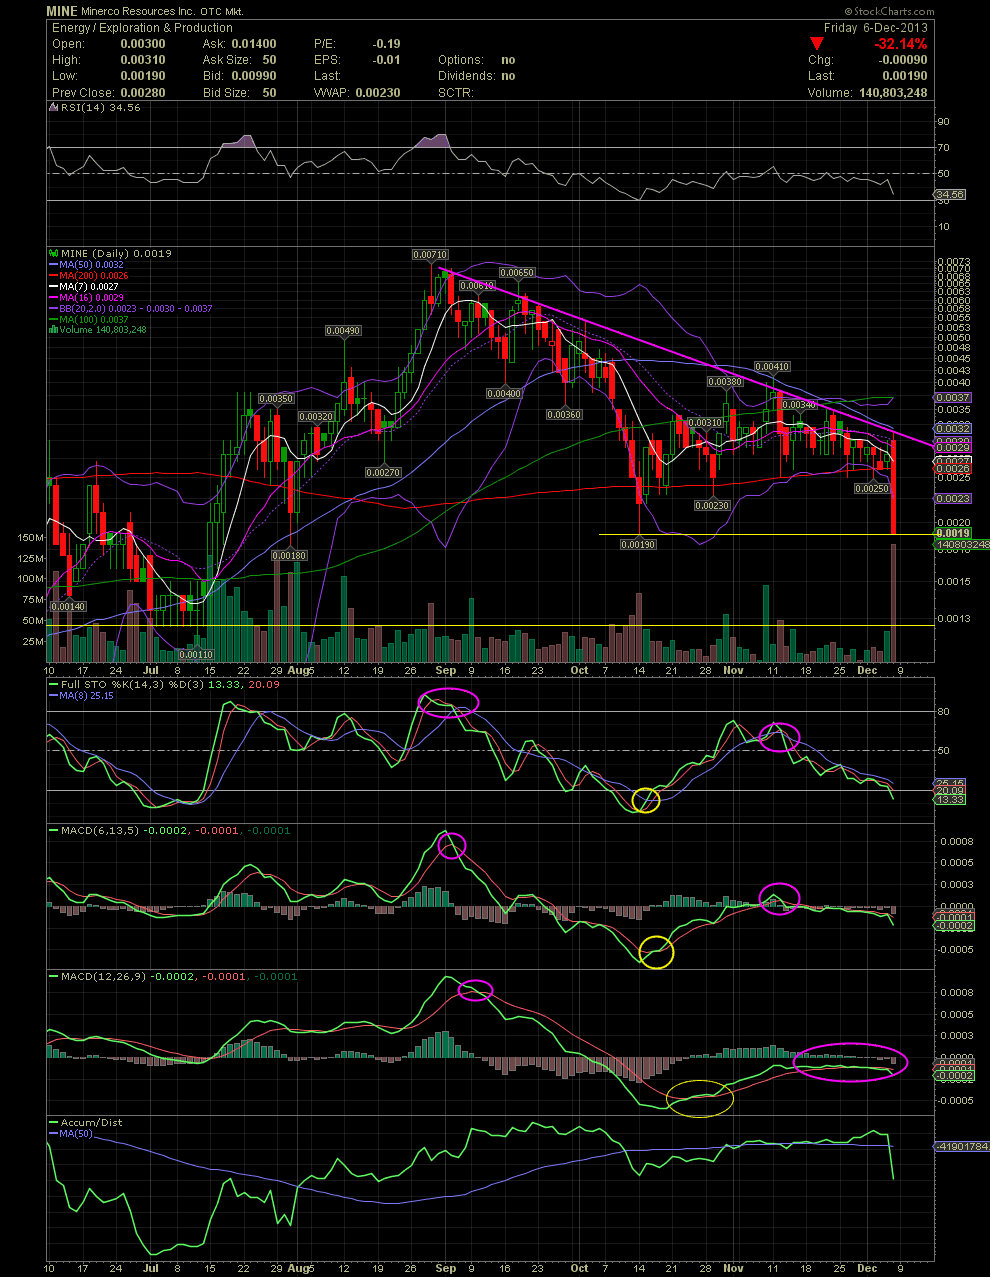
MINE Daily Chart ~ The Slide Continued into a Tota
Post# of 2561

I was asked for some technical thoughts on MINE. The last time I posted on MINE was back on Sept 17 when the stock bounced back up from .004 to .0065. The negative crossovers of the FullSto and MACD a week earlier was an indication that the stock would probably be moving down. Again, just how far a stock will fall, no one knows. When the stock failed to move higher through the short term declining tops line, that was further confirmation at that time to lighten up, if not selling everything. The stock also broke through all supports along the way including the short term moving averages and then the MA50, and important one for longer term investors, in late Sept/early Oct. The indicators moved into positive territory after the FullSto and MACDs crossed over to the positive side in mid Oct. The upside was contained by the MA100. Another run into the declining tops line in early Nov. happened, but then the FullSto and MACDs began to cross to the negative side again. The stock only closed below the MA200 once during Oct and Nov...... until Friday. Once could make a case that MINE now has a double bottom. Only a real speculator would jump into the stock now after Friday's massive Dump-A-Thon. I'll be watching. Too many other good stocks with great looking charts to choose from. GLTA

 (0)
(0) (0)
(0)