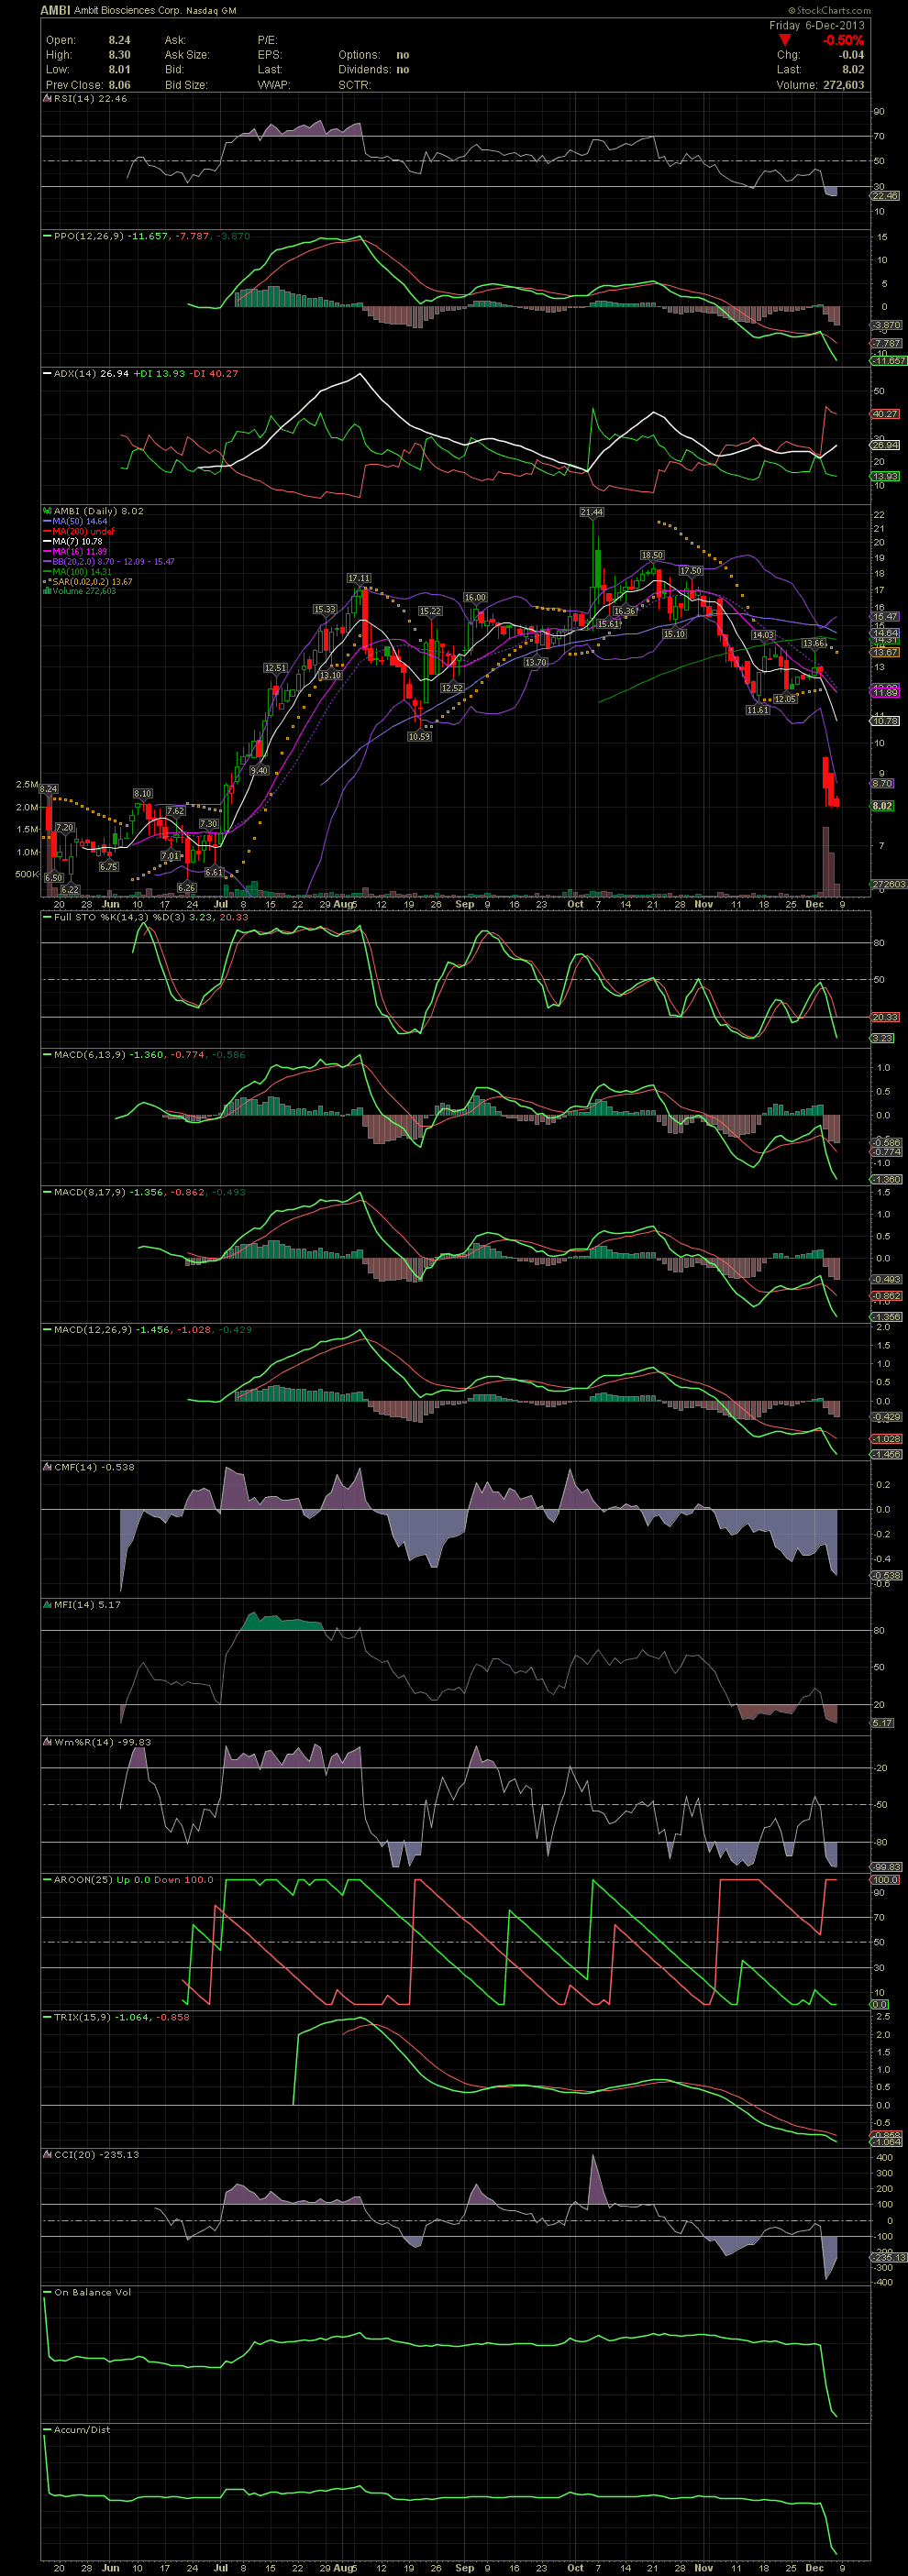
AMBI Daily Chart ~ A Stock for Your Watchlist A
Post# of 2561

A bit early for this stock, but it's on my watchlist now. The fall last week from 13.66 to 8.00 began to put into play a potential chart setup for a future pinch and/or gap swing trade. For starters, the stock fell to 8.02 and has seen three days of trading while holding 8.01. The FullSto and MACDs are tanking but not leveling out yet. Every indicator is near its bottom. There is also a gap from 12.51 to 9.52 which could be filled someday. Look at the huge volume of the last three days and compare it to the previous months of trading. Although the stock is down big time this last week, that huge volume is being absorbed by someone. And the sell volume eased on Friday. The flip side is that we are now in yearend tax loss selling season. Could be a lot more selling as for the last five months the stock was at higher levels. If interested, allow the chart to set up and use a calculated entry when things are right. GLTA

 (0)
(0) (0)
(0)