
GERN Daily Chart ~ Hello Youngparagon
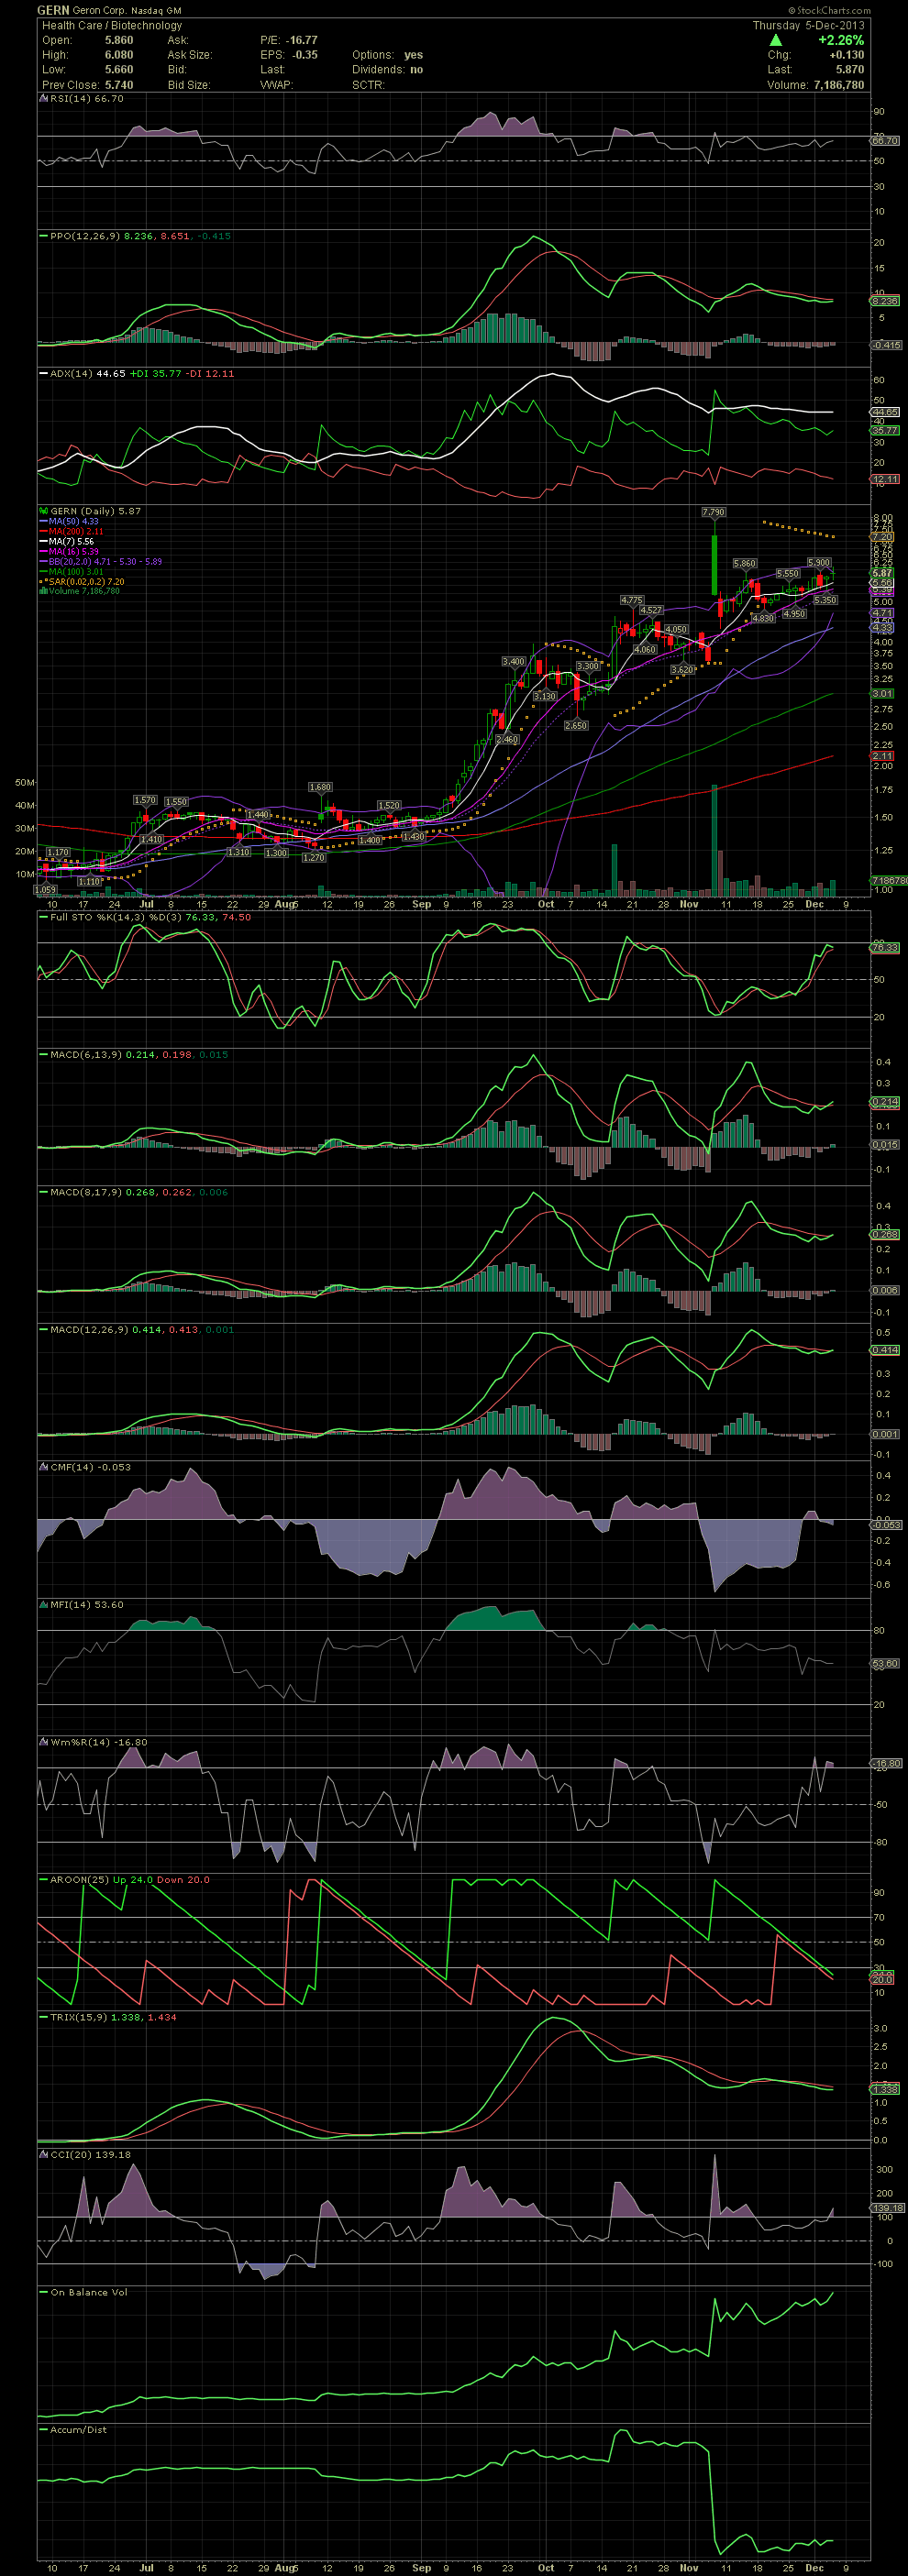
Well, with what I can see on the daily chart, it sure looks like GERN has broken out a few times. Just over the last six months, I see a clear break of a trading channel back in May at the 1.17 level. After a move up to the high 1.50s, the stock once again channeled between the 1.20s to 1.60s. Another leg up occurred in late Sept when the stock ran to the 3.40/3.50 level. After a little bit of consolidation, a move into the mid to high 4.00s happened. That was followed by a dip to the 3.60 level which now brings up into the high 5.80s. If that hasn't been a breakout from the 1.10s to almost 6.00, a worst it should be termed a huge move of almost 400%. I would sure like to have some of my stocks 'not' breakout like that, lol. I hope you own this one for months now!
As to the technicals, the chart looks like more upside is very possible before getting into really overbought territory. GERN saw some indecision today with a doji. Typically that can signal a possible reversal of a trend, whether at a high or a low. So if I were in the stock, looking for a swing trade, I'd keep an eye on things just in case the FullSto and MACDs begin to cross to the downside. The stock has been riding the MA16 and 20 since the breakout in early Sept. A few of the indicators are already in overbought and beginning to trend down. Since I don't know any fundamentals of GERN, I only have the chart to look to for a trend. Nice gains if you've been in it this year.