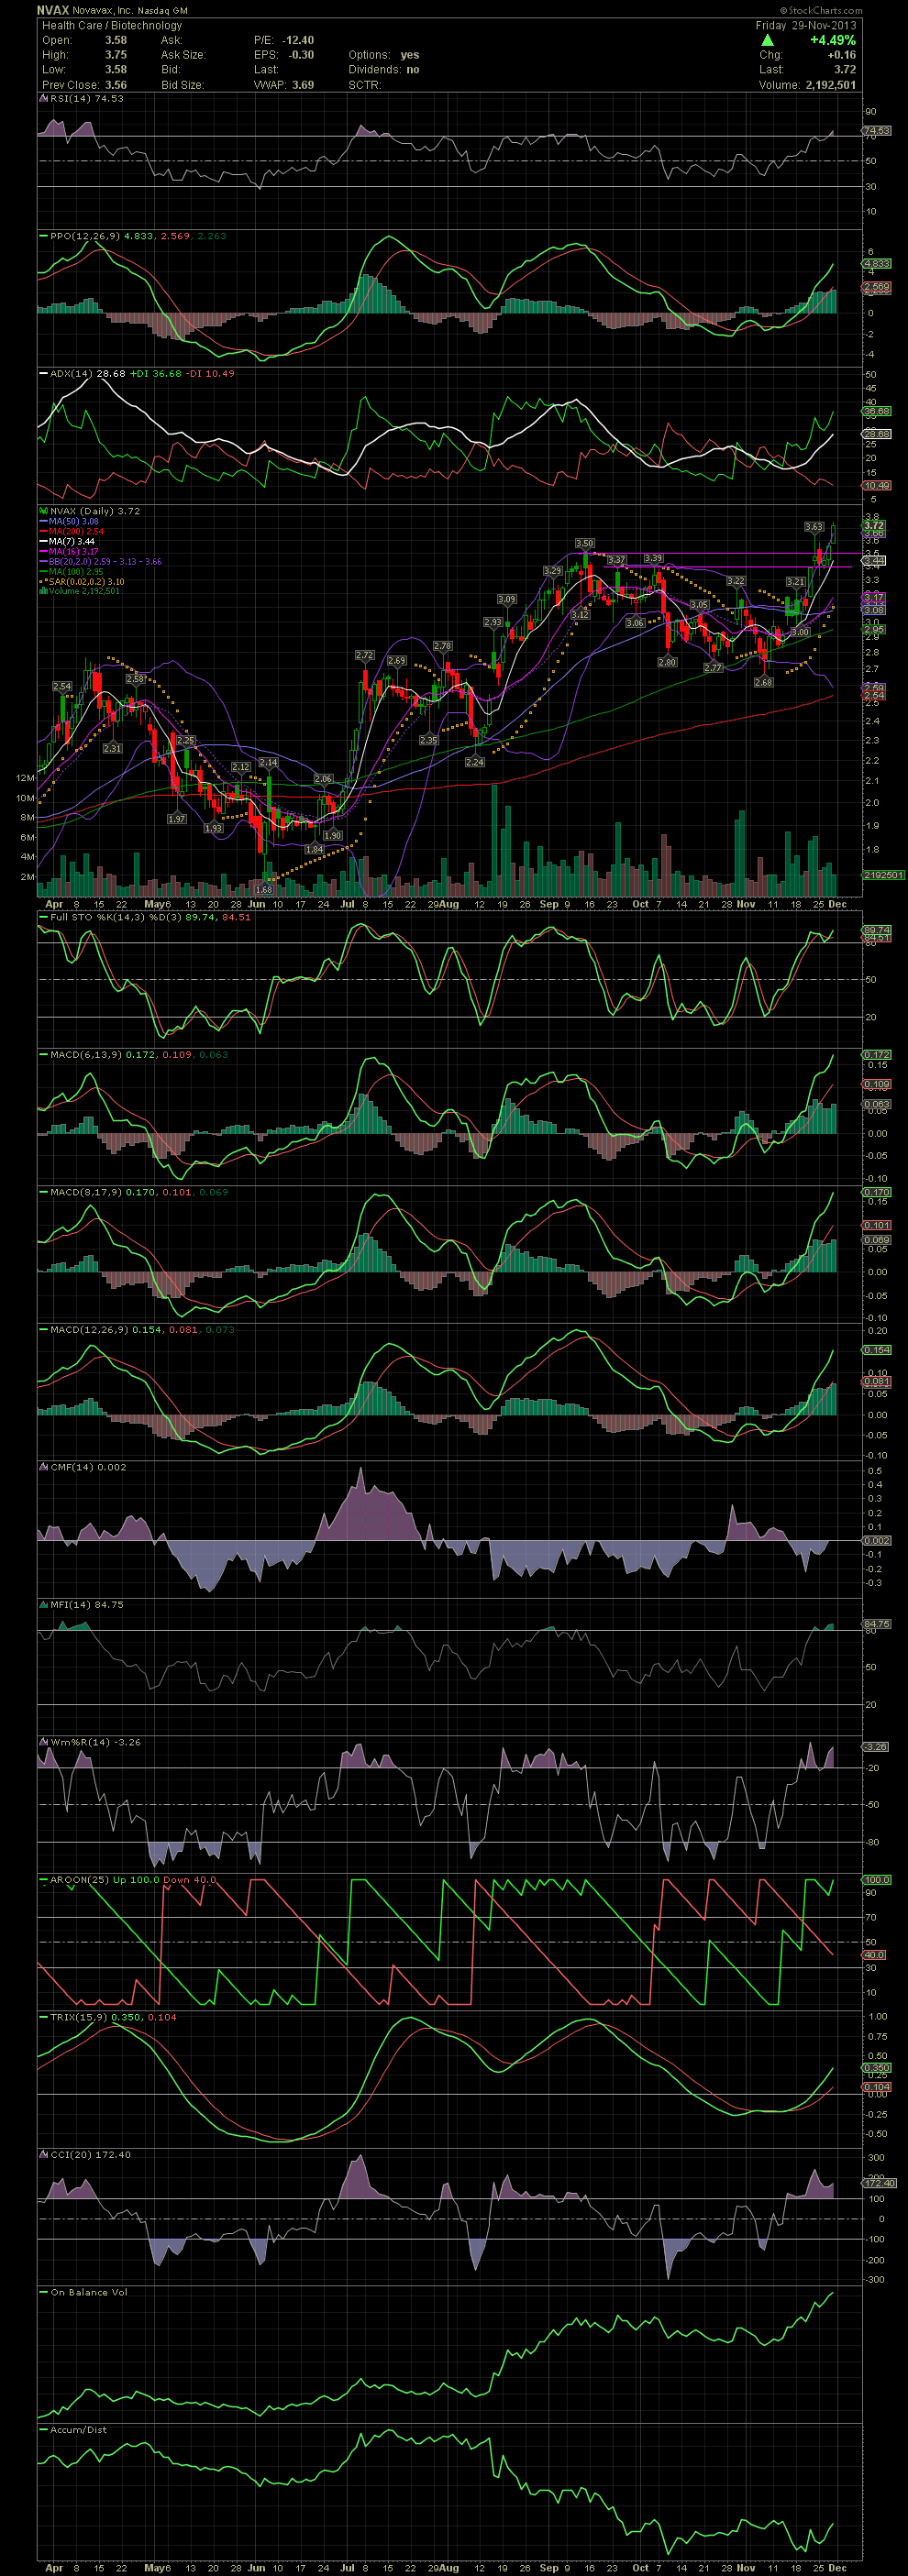
NVAX Daily Chart ~ New Highs Last Week into Blue S
Post# of 2561

What I hoped for, all of last week, was for NVAX to break and close above the 3.50 high of mid September. Both Thursday and Friday saw that happen. NVAX closed just .02 below the high of the day. More importantly is that we are now Blue Skyin'. As mentioned previously, one has to go back to mid 2009 to see the last time NVAX traded above 3.50. A quick review of the Weekly Chart shows that the MA200 is next up at 4.12. A close above 4.12 and the potential for a run to the 7.79/8.39 level is possible. GLTA

 (0)
(0) (0)
(0)